2022, a better year for generous work incentives? – how the government is really doing
by Gareth Morgan on November 3, 2021
With some very, very boring but pretty important numbers
The government has been playing around with the tax and benefit system quite a lot this year. They have increased and decreased rates, tapers, thresholds and other factors with, apparently, wild enthusiasm. All of the announcements have been, predictably, treated as stand-alone elements with those that seem to benefit people, or else buried within more broad ranging baskets of measures, where it might seem otherwise.
The reality is that the overall effect of these changes is complex and differs greatly from case to case. Any change produces winners and losers and, of course, that’s what matters to the individual.
I wanted to have a look, a little longer term, at the way in which work incentives have been developing with Universal Credit. The very recent announcement of taper and work allowance changes together with new NLW rates proposals, clearly make this a very live issue.
I have gone back to some earlier postings here and use them as the basis for comparison. To do this, I have completely ignored the introduction and removal of the £20 temporary uplift to Universal Credit rates. This is not to ignore, or minimise, the hardship caused by this, but to allow the longer term trends, if any, to appear. I wrote a guest piece on the excellent Debt Camel blog, which looked at the extra earnings needed to offset the £20 cut, in a number of different circumstances, and you can read that at https://debtcamel.co.uk/earning-to-replace-uc-cut/ .
I’ve not included the actual tables in this posting, as there are a lot of them, but if anybody is particularly interested in the detailed figures then I’m happy to pass them on.
I looked in February 2020, just before the introduction of the uplift, at the way in which marginal deduction rates worked in Universal Credit, when compared to workers not receiving the benefit.
2020, a good year for generous work incentives? – how the government is really doing
the charts below update the deduction rates discussed in that posting. The assessments are based on hours worked at National Living Wage pay levels; £8.91 an hour for 2021/2022.
The Universal Credit taper change, from 63% to 55%, and the increase in work allowances by £500 a year, take effect from December 1st 2021.
I’ve also looked a little at the NLW rates for next year and included the NI social care levy. This uses current tax and NI thresholds. There is a free reckoner showing the pre-levy and post-levy tax and NI figures for employed and self-employed at https://www.webreckoners.com/. This site includes many other very useful benefit related calculators.
Weekly Gross and Net Pay
these charts outline the effect of increasing the rates of NLW and the new National Insurance social care levy being introduced in 2022.
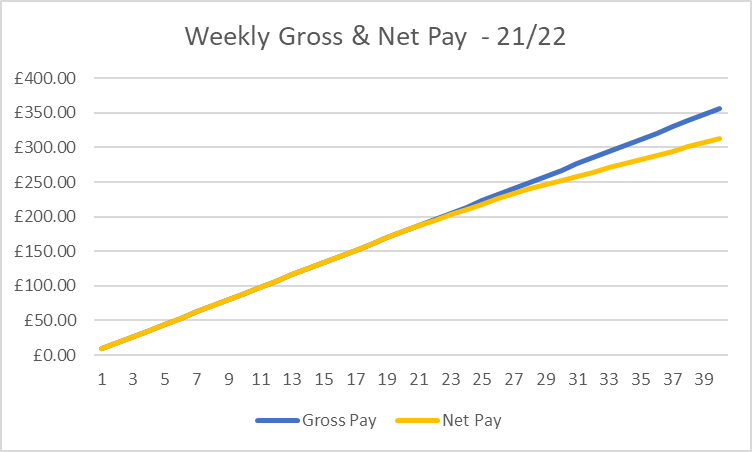
Figure 1
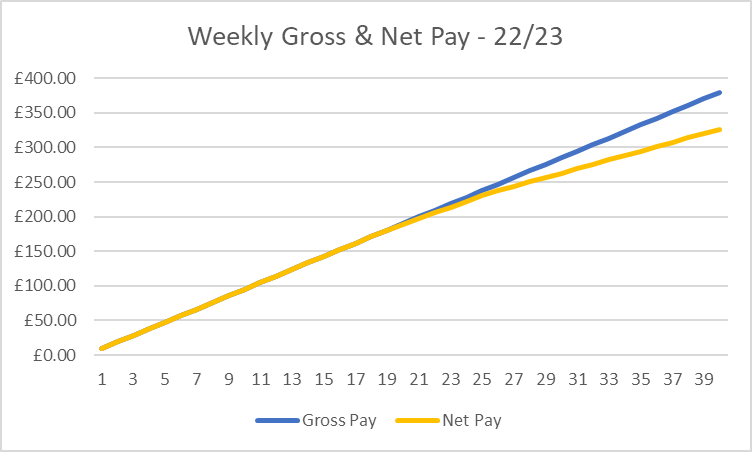
Figure 2
The other charts look at the Universal Credit changes announced in the autumn 2021 budget.
The first charts the circumstances of the claimant with no entitlement to a work allowance. The Universal Credit taper applies immediately to all earnings. The calculation is based on the post-tax and NI earnings figure
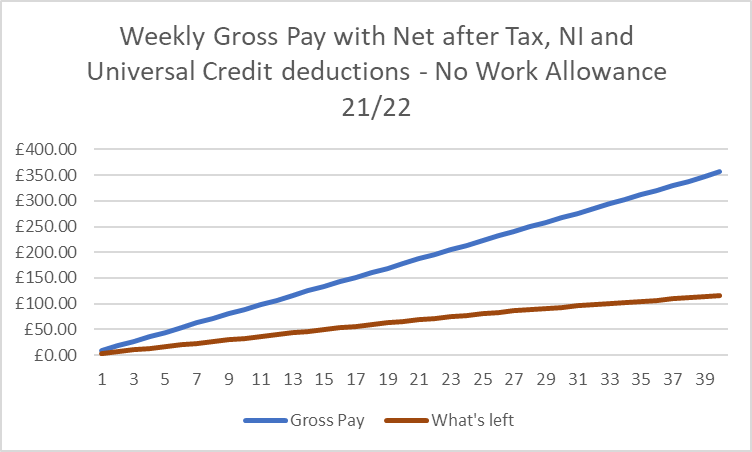
Figure 3
Figure 3 shows the results with a 63% taper applying to all earnings. For each £8.91 NLW earned, before tax and NI apply, the claimant retains £3.30 after £5.60 has been tapered away. When National Insurance, followed by tax a little later, begins to be deducted then the net earnings for each hour’s work reduce and the tapered reduction is consequently smaller for each hour.
Comparing this with the deductions for those with higher and lower work allowances, we see, in figure 4, the higher earnings of the retained with those allowances.
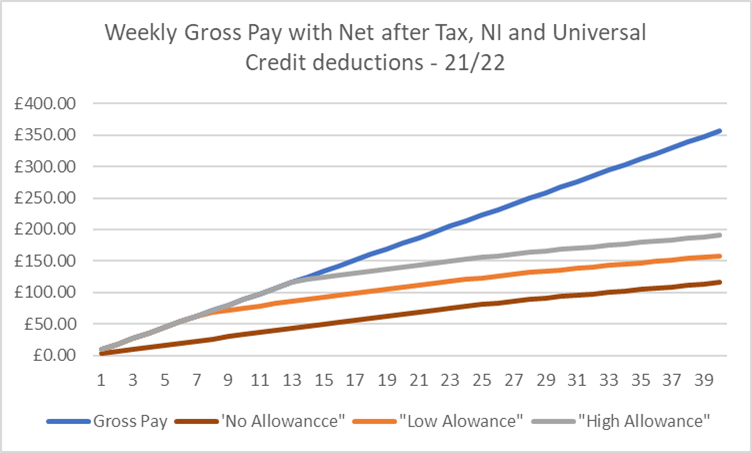
Figure 4
An alternative view, shown in figure 5, is to show the deductions for NLW level earnings.
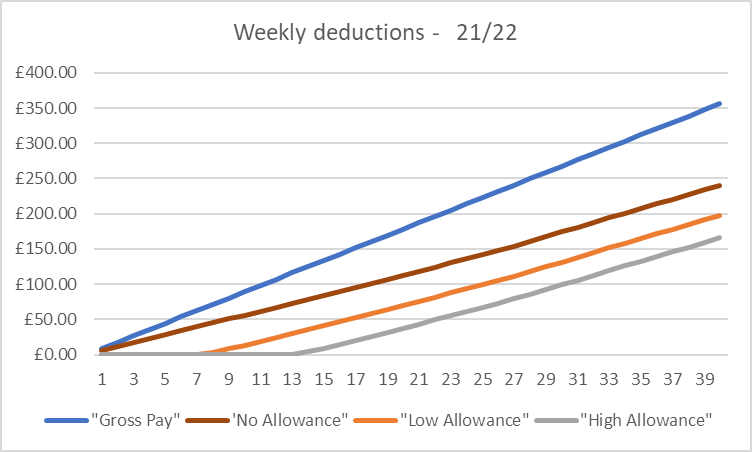
Figure 5
The consequence of the deductions from tax and NI, the Universal Credit taper and the disregard of some earnings for UC because of the work allowances, is to make it difficult for people to understand the net effect of increasing earnings.
One extra hours work will not, necessarily, produce the same increase in net income as the next extra hours work. Figure 6 shows the increasing deduction rate as NLW earnings increase.
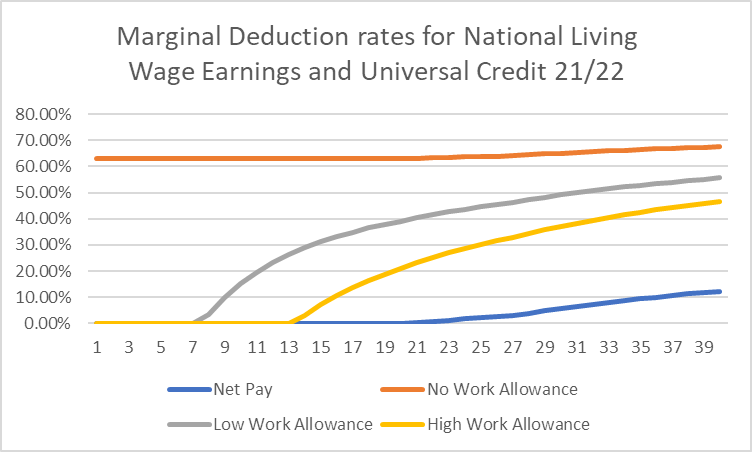
Figure 6
The much lower incentive to earn additionally for those claiming UC, when compared to the deduction rates of just tax and NI is very clear. The impact of the work allowances is also stark, where up to 13 hours a week of work can be carried out, with no impact on UC, for those fortunate enough to have a higher work allowance.
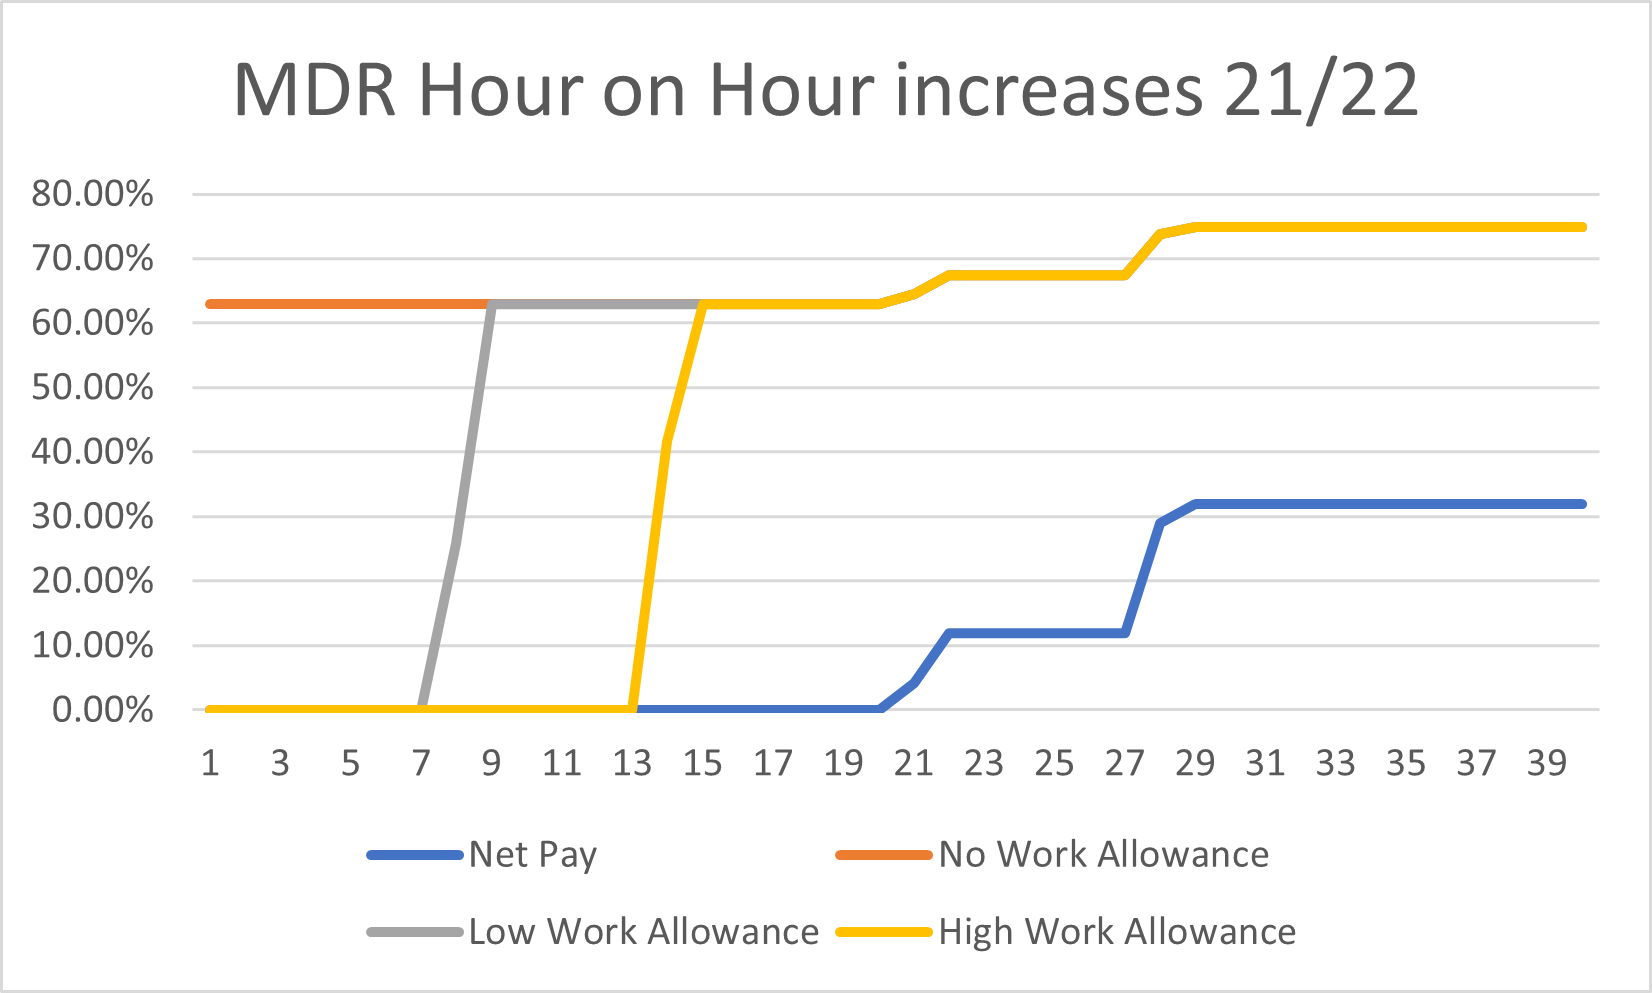
Figure 7
Figure 7 shows the step changes in deduction rates, for each hour, as earnings increase. Once work allowances amounts are passed, there are abrupt changes in deduction rates. The net pay deduction rates where firstly NI begins to apply and then income tax joins in, have less impact on UC because the taper is applied to the reduced amount of post-deduction earnings.
The equivalent figures following the announced taper and work allowance changes from December 2021 are shown in figures 8 to 11.
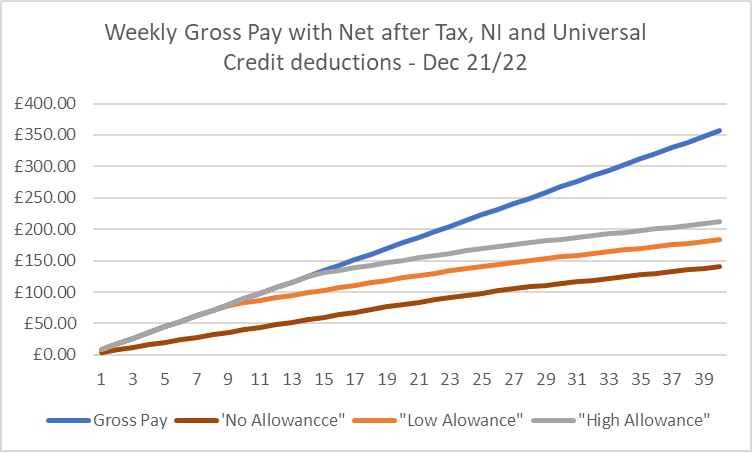
Figure 8
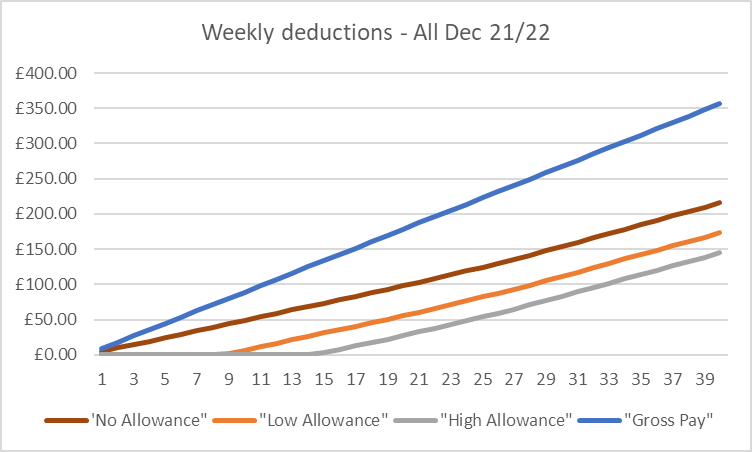
Figure 9
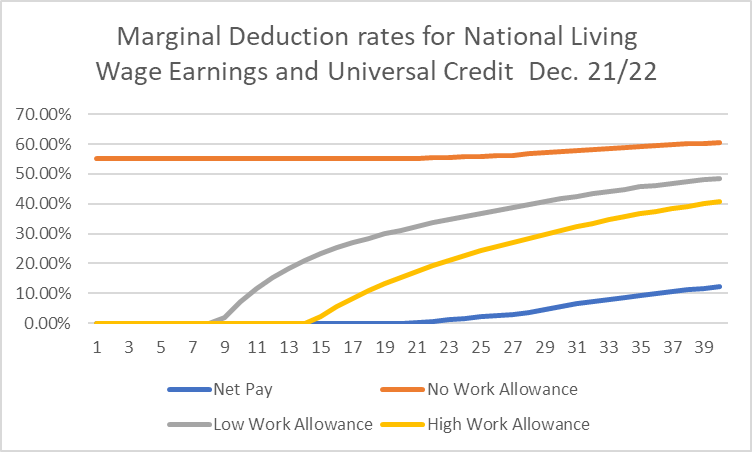
Figure 10
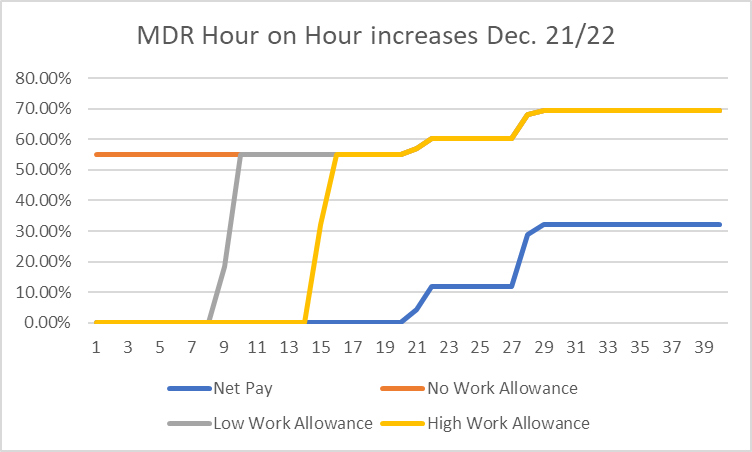
Figure 11
Comparing the differences after the introduction of the new rates produces some interesting results.
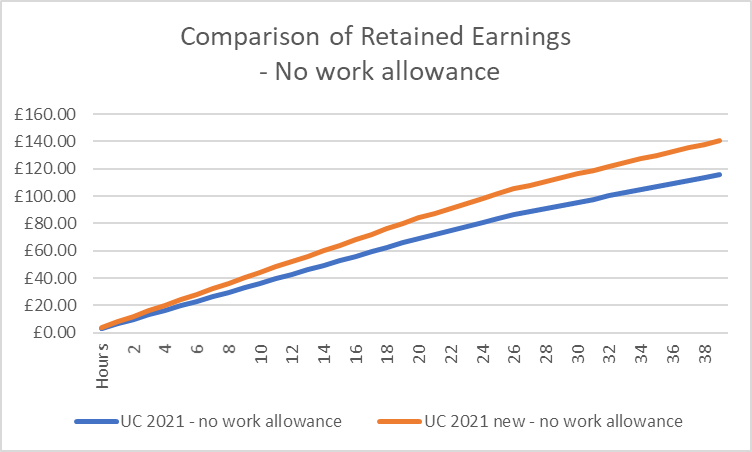
Figure 12
Figure 12 shows, as would be expected, a measurable increase in retained income because of the taper change. The post-tax and NI gains are, again as expected, increased.
Figure 13 illustrates the fact that for those with a low work allowance, and a small number of hours of work, there will be no gain. Their earnings up to the work allowance level already have no taper applying to them, so there is nothing to gain here. Once their earnings pass the previous work allowance level figure, there is an immediate 100% gain of the increased allowance, followed by the taper gain.
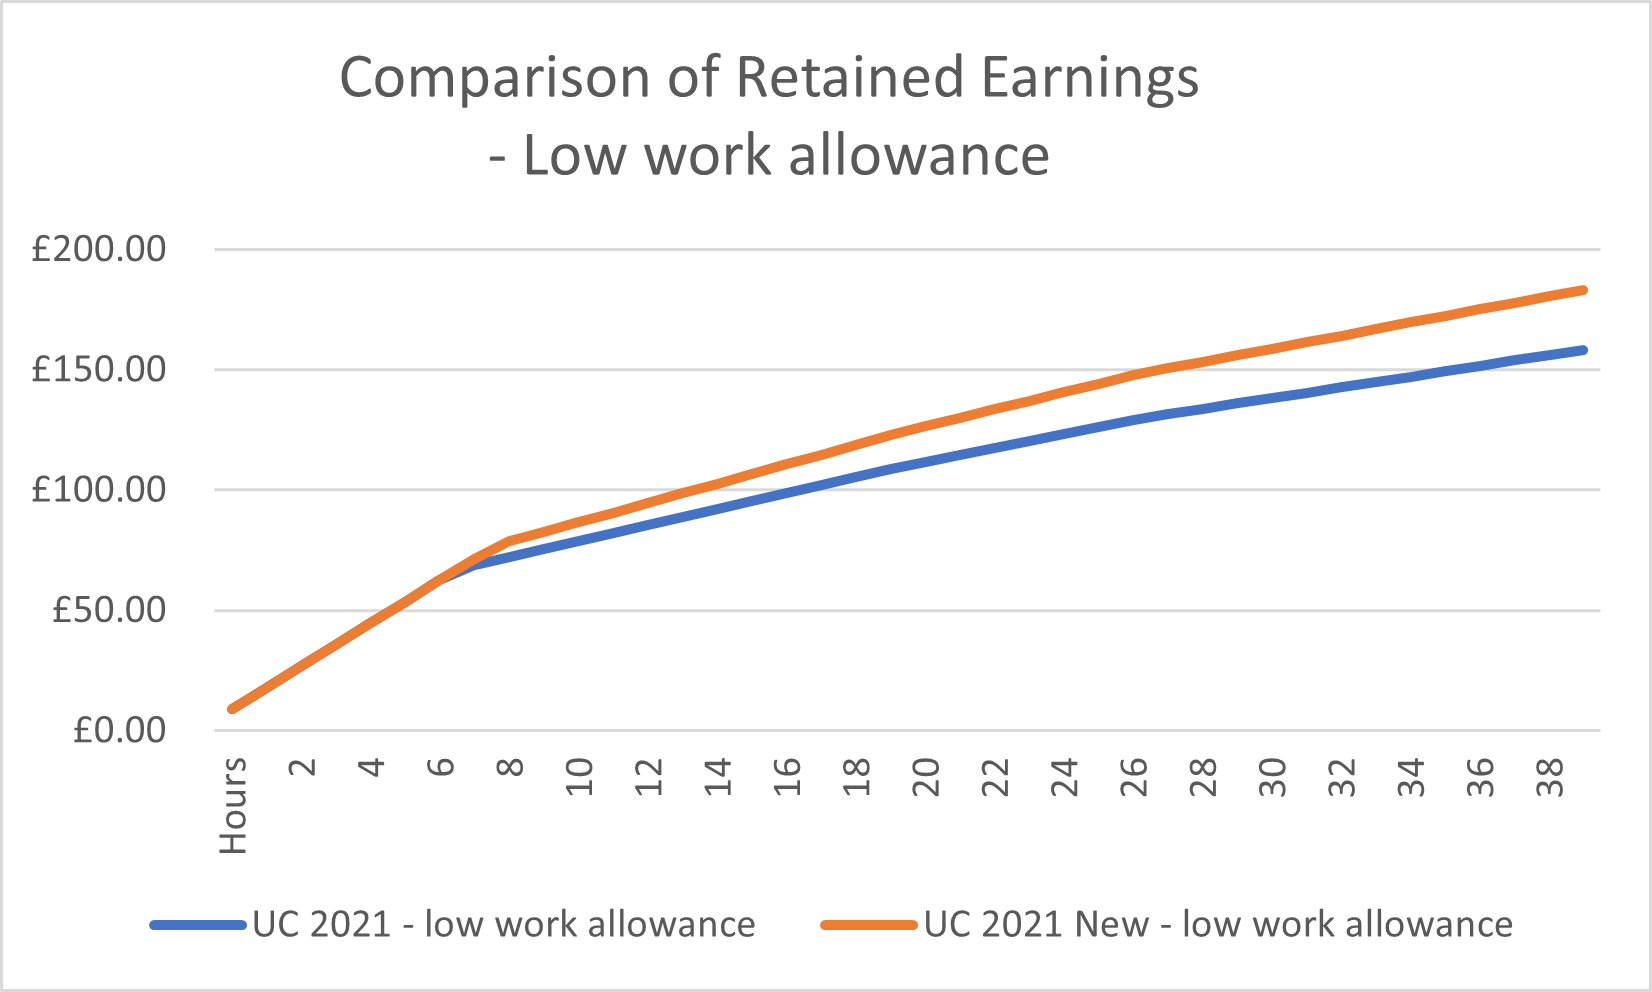
Figure 13
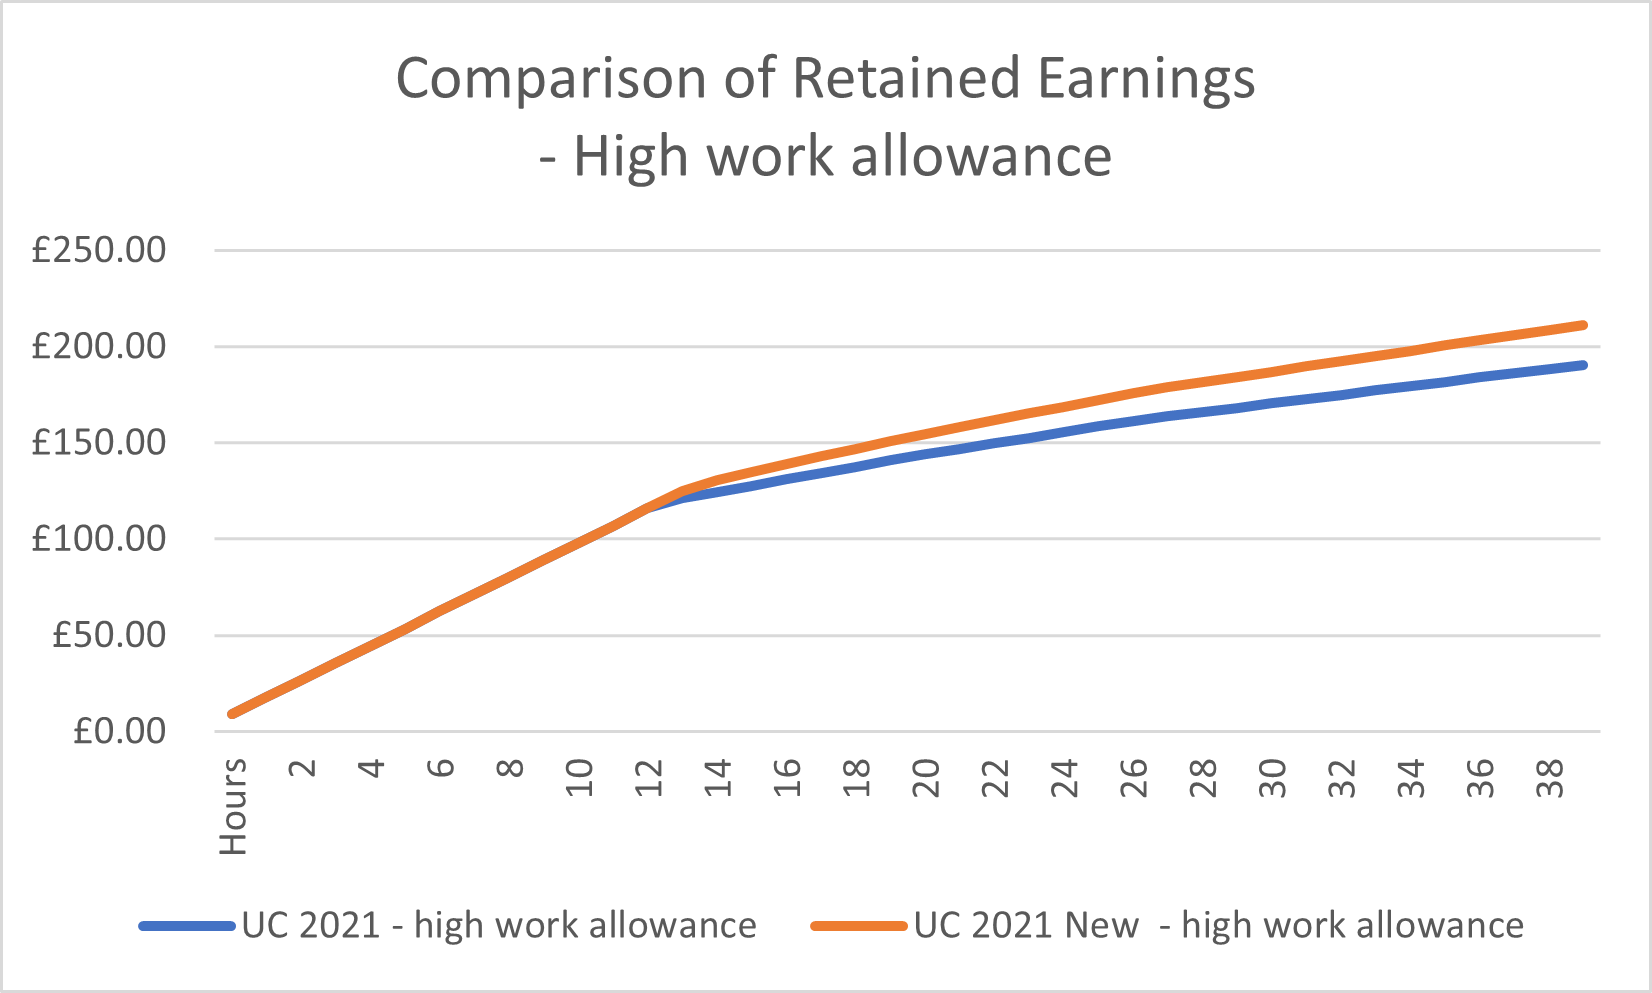
Figure 14
A similar effect is seen where the higher work allowances apply. No real gain is seen until a substantial number of hours worked apply.
In summary, the changes are welcome … but…
- they move the taper, finally, to its original proposed level
- the absence of the original work allowance, for those without children or limited capability, still reduces substantially the initial incentive to enter work
- for those with work allowances, real gain from the changes depend upon there being higher amounts of work carried out
- the more work carried out, the higher the deduction rate, per hour, applied
National Living Wage
The government is accepting [the Low Pay Commission’s] recommendation. For a full-time worker that’s a pay rise worth over £1,000 [and] it will benefit over 2 million of the lowest paid workers in the country,” the Chancellor said. “This is a major commitment to the high wage, high skill, high productivity economy of the future
Once again, the government presents a very partial view of the value and costs of increasing the earnings of the lowest paid. I looked at the beginning of last year at a very similar claim and pointed out the very different actual gain to the worker, and cost to the employer. https://benefitsinthefuture.com/national-living-wage-cui-bono/
I won’t repeat that here, the explanation still applies, but I’ll just summarise the effects of this increase, on a single hour, in table 1 below. The variations, over the previous post, are because the introduction of the NI social care levy in 2022 and the lower UC taper.
Earnings below the tax and national insurance thresholds. Earnings between the tax and national insurance thresholds Earnings above both thresholds No deduction NI deducted at 13.5% NI deducted at 13.5% and tax deducted at 20%. Gross £0.59 £0.59 £0.59 After deduction £0.59 £0.51 £0.39 Universal Credit Reduction £0.32 £0.28 £0.22 After deduction £0.27 £0.23 £0.18 Table 1
More usefully, in Table 2, in a 35 hour week, the results of the increase will be
Earnings below the tax and national insurance thresholds. Earnings between the tax and national insurance thresholds Earnings above both thresholds No deduction NI deducted at 13.5% NI deducted at 13.5% and tax deducted at 20%. Gross £20.65 £20.65 £20.65 After deduction £20.65 £17.86 £13.73 Universal Credit Reduction £11.36 £9.82 £7.55 After deduction £9.29 £8.04 £6.18 Table 2
For the full-time worker, described by the Chancellor, the gain of over £1000 a year gross will be at least halved for those receiving UC and may only be 30% for those most affected.
It seems that the overall effect of the changes is to further emphasise the drive for employment of those on Universal Credit. This time the carrot, rather than the stick.
Comments
Excellent analysis – I fund it really interesting. Thanks Gareth!