Benefit Cuts – £18 Billion, £25 Billion or more?
by Gareth Morgan on April 16, 2014
The two sets of announcements about benefit cuts, and increases, that were made in the Emergency Budget (June 2010 in the tables) and Comprehensive Spending Review of 2010 (SR 2010) became a headline figure of £18 billion a year in cuts to existing benefits. That figure is still widely used today although it should be somewhat higher as some announced increases and cuts were later cancelled.
The government has just published an interesting set of figures which takes those announcements, and those made subsequently up to the 2014 Budget, and collates the costings year by year.
It’s well worth a look at the tables which can be downloaded from https://www.gov.uk/government/publications/welfare-reform-collated-costings-2010-to-2014
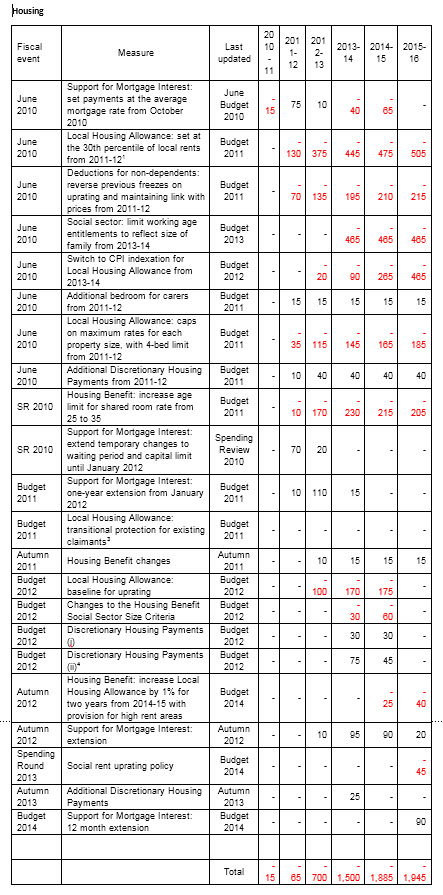
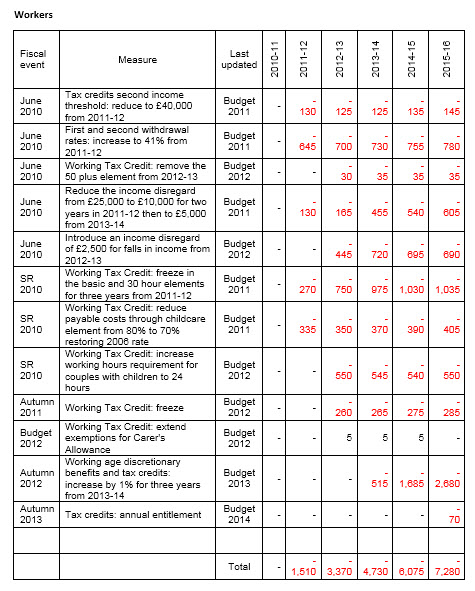
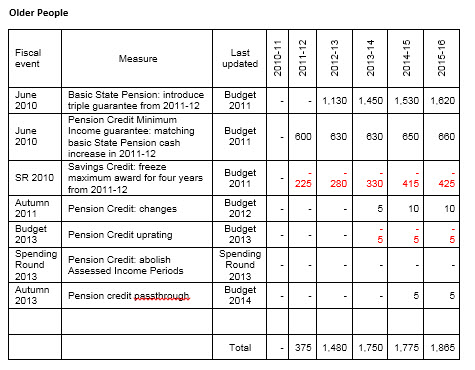
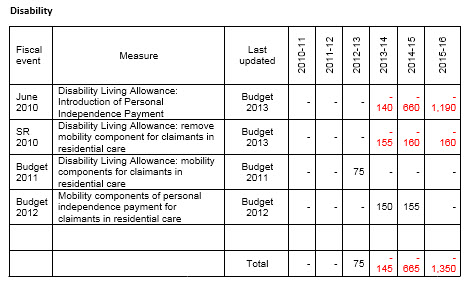
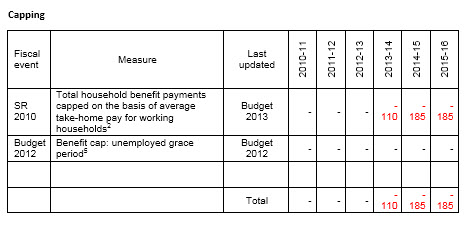
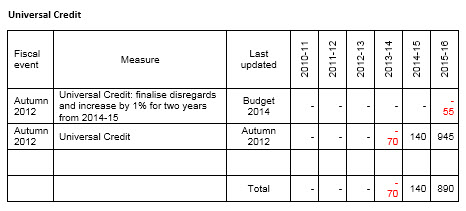
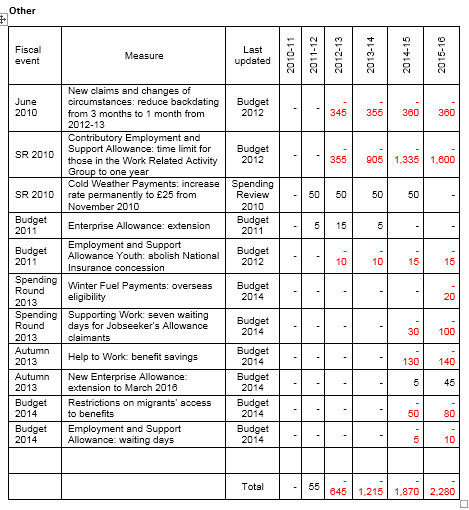
I’ve done some crude analyses of the figures, separating them into direct cuts/increases and process savings. I’ve then categorised the direct cuts / increases into broad groups of impact. There are some overlaps of course but I’ve tried to include items only in the most relevant grouping (my selection entirely – and apologies that the tables are odd sized images. I can’t get tables working sensibly in this blog).
In summary, after removing those elements which seem to be related to procedures and processes, I’ve ended up with direct cuts year by year, in millions, of:
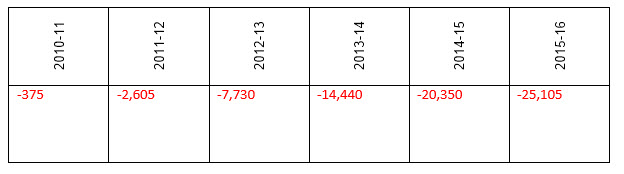
BUT…. The notes point out “Most measures are costed to 2015/16, although some costings extend only to 2014/15. This does not necessarily mean there is no effect in 2015/16.”
There are a substantial number of elements in the tables without values in the 2015 – 2016 column, as can be seen below, which might be assumed to have some costs or benefits in that year. It can be assumed therefore that the total for that year may be higher than shown.
“If you invest your tuppence / Wisely in the bank / Safe and sound / Soon that tuppence, safely / Invested in the bank / Will compound,” – Mary Poppins
Compound interest is a wonderful thing; it makes value grow more quickly as time passes. Sadly it works both ways and that can be seen in the largest item in the tables.
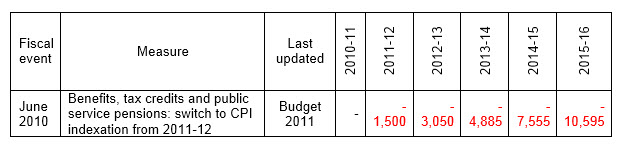
The difference between the RPI indexation method of old and the new CPI (or frozen, or 1% or …) indexation is that each year there will be a smaller percentage increase on a smaller previous years increase. I’ve looked at this before, about two years ago in http://blog.cix.co.uk/gmorgan/2012/05/19/real-value-of-benefits-will-be-halved-in-50-years/ but the figures in these tables are revealing in their stark reality.
It’s interesting to look at the winners and losers in the groups that I, arbitrarily, chose.
- Workers, the government’s target for incentives we are constantly told, will see a £7.3 billion a year cut by 2016
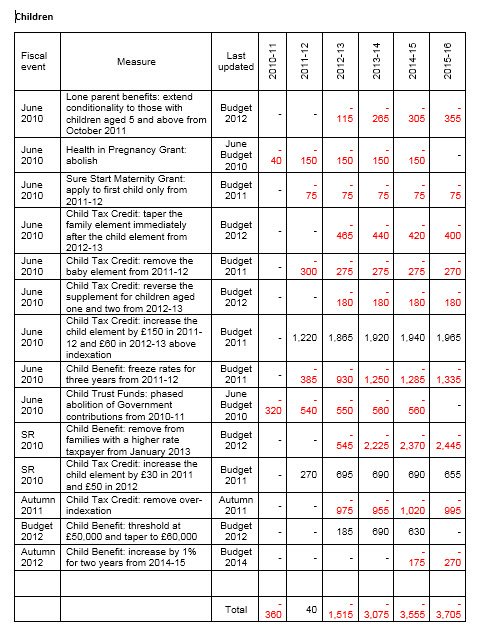
- Children will face a £3.7 billion loss annually
- Housing support gets cuts of almost £2 billion a year
- Disability support drops by £1.35 billion a year
There are winners though
- Universal Credit gets an extra £890 million a year
- Older people get £1.8 billion extra annually
The older people’s increase is not new money of course; it’s largely a protection against the cuts inflicted on other benefits by indexation changes and the need to match Pension Credit to SRP increases (thus avoiding cuts in Pension Credit). It must be remembered that there are future changes to older people’s benefits which are not yet included in these tables – mixed-age couples, abolition of Assessed Income Periods, a capital cut-off, new pension credit schemes, single-tier pensions etc.
To summarise the answer to the title of this piece – the answer is ‘More’. How much is unclear but it is clear that it will be increasing year on year.
For me; I’ll just be using £25 billion plus from now on.
Tables
It is useful that the figures include the original impacts of measures later withdrawn and an estimate of the offsetting spend consequential on the withdrawal. These figures are not necessarily identical of course. For example, the proposed increases in child tax credit appear in June 2010 and SR 2010 while the reversal of the second of both proposed increases appears in Autumn 2011 and excludes the first increases. A clearer example is that of the proposed Housing Benefit cut in ‘Reduce awards to 90% after 12 months for claimants of Jobseekers Allowance’ in the 2010 emergency budget. The reversal appears in the Budget 2011 as ‘Housing Benefit: not introduce reductions for long term jobseekers’. The savings figures of £100M and £110M are offset by £105M and £115M in 2013/2014 and 2014 /2015 respectively.
In the tables figures are £ million (negative figures represent a saving).

Comments
[…] Gareth Morgan has posted detailed estimates of the level of social security cuts, which he puts at £25bn rather than the headline figure of £18bn. The cumulative figures over the last few years are more of interest to economists, who are looking at the levels of resources in an economy overall, than to people concerned with benefits administration, for whom the annual figure is more important: in the current financial year, the largest impact seems to be through cuts in Child Benefit and Tax Credits, but beyond that the effects of cuts in housing support are starting to bite. The cuts to date have probably suppressed economic recovery; it remains to be seen what effect they will have on the economy in the immediate future, as we slide towards the next election. Rate this:Share this:EmailLike this:Like Loading… […]