Income certainty and low pension savings
by Gareth Morgan on January 12, 2018
There is concern, increasingly voiced, by a number of well-informed commentators, about some of the consequences of the pension freedoms. The complexity of choices, the lack of knowledge of most pension savers and the actions of some advisers, particularly around pension transfers, have led to calls for changes that would lead to safer and more certain income outcomes. A number of the suggestions seem to involve schemes that could lead to almost compulsory regular incomes.
While I share their concerns, I’m not so persuaded by some of their suggestions. The problem is that while a ‘wage for life ‘or ‘certainty of income’ introduces more safety into the situation, it also has the potential to reintroduce the failings of annuities (as described later) for many people. The same issues arise for Equity Release where irregular amounts of drawdown can be very advantageous but regular income is a very poor choice for less well-off people, as is shown later.
People with above average levels of pension savings, or occupational pots, are in a very different situation to poorer people. What may very well be a sensible solution for them may not be applicable to everyone. The danger is that if some of the proposals being discussed were to be adopted as broad-brush answers, then many of the least well-off pensioners could become even worse off.
Most people, in the UK, live in a world where their retirement income depends on the state. That state contribution, in its most important form, is the result of the National Insurance system which is a product, in its current form, of the 1940s and the development of the welfare state. The second element, again from the welfare state, is the safety net. That safety net is the means tested protection against absolute poverty and destitution. Many people still need that safety net and, sadly, too many of those who qualify for that help don’t get it.
There seems to be an assumption that the people who most need a regular income, and the certainty that it would bring, are the least well-off in society. While it is undeniable that people with lower incomes need to be confident about their income, so that they can budget and plan, that does not mean that all their pension savings need to be delivered as a regular payment. For many people that can be the worst choice that they can make.
I thought it worthwhile trying to bring together some of the reasons why this is the case, into one place, to help inform the discussion. While trying to keep this as short as possible, the complexities of interaction between many of the elements involved, and the internal complexities of some schemes, inescapably makes this a bit lengthy. I’ve also tried to pick up on internal inconsistencies in the way that pension savings and income are treated in the benefit system. I’ve summarised the main points below and expand or explain them later on in the document. I also provide a few detailed examples at the end of the document.
Core facts
- 37% of people over 55 have less than £10,000 in pension savings – occupational pensions, personal pensions, retained rights in private pensions and pensions in payment.
- The safety-net in the benefit system means that the income and savings of poorer people have a very different effect on overall income than those of better off people do.
- Over a third of all households entitled to Pension Credit don’t claim it.
- State pensions and benefits form the most important part of pensioners’ incomes. In 2013 they made up 51% of the gross income of retired households, much more for the poorest.
- Means-testing makes it certain, for many people, that getting a regular income from pension savings will not give them an extra penny in their pockets.
- Pension savings and incomes are treated differently to other kinds of capital and incomes, with some logical inconsistencies within their treatment as well.
- The relationship between pensions, tax and benefits is complex and poorly understood by providers and advisers in the financial services industry.
Pension savings
The Office for National Statistics produced a detailed report on ‘Individual personal pension wealth by age band July 2012 to June 2014’ in June 2017. It is an extract from the Wealth and Assets Survey (WAS) – a longitudinal sample survey of private households which started in 2006.
The relevant figures in the extract are defined as “PRIVATE PENSION WEALTH – The accrued value in all pensions that are not state basic retirement or state earning related. This includes occupational pensions, personal pensions, retained rights in private pensions and pensions in payment”. This is one of four categories in the report; the others being property wealth (less mortgages), physical wealth (including possessions, valuables and cars) and financial wealth (bank accounts, stocks, shares and cash but offset by liabilities).
The results are based on a large sample, when compared with other similar studies internationally, and careful weighting ensures that the results are robust. While the study looks at individuals, and it will be pointed out that in families cross-support and provision can be expected, the survey’s latest findings show only 11% of individuals expect to get financial support in retirement from current or former partners, from families or from someone else[1].
This report shows that over half of the population (51%) have pension savings of less than £10,000. Unsurprising perhaps, as that includes everyone over the age of 16, but focussing on older people demonstrates that:
33% (2,291,500) of people from 55 to 64 have less than £10,000 in pension wealth;
35% (2,048,800) of people from 65 to 74,
46% (2,221,700) of people aged 75 and over.
Overall, 37% (6,612,000) of people over 55 have less than £10,000 in pension savings. (Remember this, that £10,000 figure becomes important later).
The next band in the report shows:
13% (898,300) of people from 55 to 64 have between £10,000 and £50,000 in pension wealth;
13% (758,800) of people from 65 to 74,
21%% (1,056,100) of people aged 75 and over.
15% (2,713,200) of people over 55 have between £10,000 and £50,000 in pension wealth.
That means 52% of all people over 55 have less than £50,000 in pension savings – 9,325,200 people.
Most people!
The safety net and the problem with a means test
The safety net is intended (or at least was intended) to ensure that people had a minimum decent standard of living. It is still, in the main, made up of a number of different means-tested benefits. There are some benefits only for people of working age and others for older people. There are schemes to help with the cost of rent or council tax. For people under pension age the new Universal Credit scheme is taking over from many of the previous benefits but for people over pension age, the schemes that matter are Pension Credit, Housing Benefit and Council Tax Reduction.
All means-tested schemes have a common basis. They must assess how much you need, then look at how much you’ve already got and finally decide how much, if anything, you should be given.
How much you need is usually based on how many people are in the family, their ages, their health or disabilities and their housing costs. Confusingly the interaction benefits are assessed for families while tax is individually based.
How much you have is calculated from their family’s earnings, other income and capital. Capital is normally taken into account by calculating a notional income that could be received from it; normally at a much higher than realistic rate.
The simplest situation is typically someone who has needs but who has no resources. In that situation, for most benefits, they will be entitled to receive the amount that they have been assessed as needing. Think of that as the starting point. From there on, the support starts to be reduced.
While there are some earnings disregards which may not therefore affect the amount taken into account, most other income including state and private pensions will reduce their means tested amount penny for penny. For many people that means that they will have very little, if any, real gain from a small level of pension or annuity. Over the past two decades, governments of all persuasions have been more generous to pensioners with state support than to those of working age. Means tested benefits have also risen faster than National Insurance based pensions as well; at least until the introduction of the New State Pension (nSP) in 2016. In recent years, that meant that the basic State Pension (bSP – the old State Retirement Pension for those who reached pension age before 6th April 2016) fell behind the amount of money that means tested Pension Credit said people needed.
This caused a real problem. By 2015, the means-tested Guarantee Pension Credit for a single person was £151.20 a week while those on a full bSP received £115.95; a difference of £35.25 a week (£152.75 a month). The Moneyfacts website reported in 2015 that a single person aged 65, with a £10,000 pot, would typically get an annuity of £476 a year (£39.66 a month). Someone getting Guarantee Pension Credit of £152.75 a month, who then bought their annuity which gave them £39.66 a month would just see their Guarantee Pension Credit reduced by the same amount. They wouldn’t gain a penny in real income. On the basis of the Moneyfacts annuity estimates, the Guarantee Pension Credit would be reducing penny for penny until it ran out with an annuity bought with a savings pot of £38,514.
Viewed on a chart, the actual net income of somebody in this situation, as their pension or annuity income rose, would just be a flat line.
Until the pension freedoms, there was, effectively, no choice for people in this situation – they were forced to buy an annuity; and pay the consequences.
To try to mitigate this ‘flat line effect’, a second Savings Pension Credit was introduced with a complex calculation which attempted to give a small top up to those with low amounts of pension savings. From a starting point with a relatively small maximum value, this benefit has been reduced year-on-year and now abolished for those receiving the nSP.
In April 2015, the average pension pot was £29,000, according to a report published in 2017 by Aegon. That amount would provide an annuity of £115 a month. The net result, in extra money to spend, for a full bSP pensioner would be zero.
In 2015, a full bSP was £115.95 a week, or £502.45 a month. If we were to add £115 a month of regular income, then the results would be:
Guarantee Pension Credit of £37.74 a month – the annuity would not be enough, even deducted penny for penny, to wipe out the entitlement to this means tested benefit.
The anti-flat-line Savings Pension Credit would have been £41.55 a month.
Even though the total state pension and annuity fell below the personal tax allowance, the means test effectively produced a marginal deduction rate of 64%.
With pension savings of £10,000, which would produce a regular income of £39.66 a month, there would have been a Guarantee Pension Credit entitlement of £26.10 and no entitlement to Savings Pension Credit.
A marginal deduction rate of 100%.
Further problems happen because of other ways in which the means test interacts. The needs figure can be higher if the person has disabilities, some housing costs or is a carer. A greater needs figure means that it takes even more other income to reach a point where the Pension Credit stops and any real gain in income begins. If income is lower then, again, it takes more money before any real gain is seen as the benefit reduces pound for pound.
The poorer someone is, the more annuity, wage for life, pension or other regular income is needed to get any real increase in income.
Benefit take-up
The income of poorer people is not helped by failings in the support system. There are few circumstances in which benefits are given automatically to those qualified to receive them. The norm is that such benefits must be claimed, often with a lengthy and off-putting process. The result is that many benefits go unclaimed. This is income for people who would be found to have less than they need to maintain a decent standard of living. There are many reasons why these benefits are not claimed but research shows that the main reasons are ignorance of the benefit or of entitlement.
The numbers of older people who do not receive the benefits to which they are entitled are large:
- About a third of pensioner households entitled to Pension Credit don’t claim it[2]
- Over half of home owners entitled to Pension Credit don’t claim it
- Over half of all those entitled to Savings Pension Credit don’t claim it
- About 40% of pensioners entitled to Council Tax Reduction don’t claim it[3]
Working age benefits and tax credits are poorly claimed as well, of course, and are going to have an increasing role in supporting older people and pensioners in the future, as pension age rises.
Housing costs
Help with housing costs, as part of the safety net, is again an element which makes understanding real income difficult. Some kinds of housing support have been built into the main means tested benefits; in particular, help with mortgage interest. From April 2018, direct mortgage interest support will stop and be replaced by loans, repayable on death or sale of the property and with compound interest being charged. Poorer people though are more likely to rent than own their homes, giving them an ongoing liability and less assets. Support to help with home ownership tends not to benefit the poorest or oldest either.
Help with rent and Council Tax has been given by separate benefits administered by local authorities. Although local authorities in England now operate their own Council Tax Reduction (CTR) schemes for people of working age, they must follow national rules for older people. There is a UK wide scheme for rental support called Housing Benefit (HB).
Both these benefits are automatically paid at the maximum eligible rate, if Guarantee Pension Credit is being received. Once it stops being paid then their own means test, which has a broadly similar way of assessing need, begins to be applied.
One crucial difference between the locally administered means test for these benefits and that of Guarantee Pension Credit is that there is a test of capital and savings which stops all support for housing, once capital reaches £16,000. There is no such capital cut-off in Pension Credits. It is very easy therefore to lose a substantial amount of housing support by taking a few pounds too many from your pension savings.
Differences in the way pension savings are treated
Pension savings and income have been treated differently, by the benefit system, for many years. The options that are open to people, in the way that they can use their pension savings, following the introduction of the pension freedoms, have meant that some of the different treatment now seems less justified.
There are important differences in the way savings are treated by different benefits as well; largely because of age.
Pension savings that are not being used are completely ignored for people below state pension age. The savings are not treated as being capital in the way that other savings are. Only once money starts to be withdrawn from the pension scheme is it taken into account.
Where some people may treat a drawdown account in a similar way to an ISA, or other bank account, the value of the pot is ignored where it is saved as a pension but taken into account when in any other form. This means that a value of over £16,000 in savings may disqualify someone from receiving any means tested benefits. People who are advised to move their pension savings into some other form, such as buy to let properties, ISAs or other investments, may suddenly find themselves losing their previous benefits.
For people over state pension age, there are different rules. If pension savings are not being used, but could be on request, then an amount of income is calculated from it. The amount is based on the annuity tables produced by the Government Actuary’s Department (GAD). If money is being withdrawn from the scheme, but at a lower rate than the GAD table’s amount, then the higher figure is used as income in the means test calculation.
Income is taken into account in its entirety, reducing Pension Credit by the same amount. Capital generates a notional or ‘deemed’ income. For Pension Credit, the calculation takes into account any amount above £10,000. For every £500, or part, the means test assumes an income of £1 a week. That reduces the benefit by the same amount. Any real income derived from capital, such as interest or dividends, is completely ignored.
Working age benefits have an even more extreme notional interest rate where £1 a week is generated by every £250, or part, above £6000 up to the benefit cut off point of £16,000.
Effect on National Insurance benefits
Unlike other forms of income, income from pensions affects the usually non-means-tested contributory benefits as well. For working age pensioners claiming Employment and Support Allowance (contribution based), half of their pension income over £85 per week will be taken into account. For Jobseeker’s Allowance (contribution based), all of any pension income over £50 per week will be taken into account.
Providers’ duties
For pension providers there are also significant administrative overheads where there are untaken pension savings. As the DWP official guidance points out:
Pension fund holders must provide the Decision Maker with information about
- the maximum amount of income available from the pension fund and
- the amount of income that would be available if the funds were held in a scheme that produces an income.
This information is based on tables prepared by the Government[4]
This requirement has become more onerous following the pension freedoms as, from the guidance:
The claimant’s pension pot is required to be re-valued
- after every drawdown of capital
- after every drawdown of income which exceeds the applicable notional income amount
- upon the claimant’s request.
The importance of £10,000
For Pension Credit, the disregard of the first £10,000 of capital can be important and useful. Not only is the capital itself ignored but any income derived from it. Above that figure the usual capital rules apply.
The first £10,000 of pension savings are not ignored. They aren’t treated as capital but they do generate the notional annuity figure set down by the GAD tables. In January 2018, the notional income from £10,000 of pension savings, for a 66 year old person, would be £43.33 a month.
This leads to what may seem to be a contradictory results for those with small amounts of pension savings.
Take money from your pension savings as regular income and it’s all taken into account reducing your benefit. Don’t take money from your pension savings and it is assumed to generate an income which reduces your benefit. Take that money as lump sums however and the first £10,000 you hold, at any one time, is ignored. Effectively the notional income rules assume that somebody receives 5.2% interest on their pension savings. Unless their pension savings are growing at more than this rate, there seems no real incentive to leave their money unused. This is reinforced by the fact that any income they could derive from the money when withdrawn is also ignored.
The actual position is, of course, complicated by the tax treatment of money withdrawn from the pension pot and I have commented on that in other papers. In the case of low levels of pension savings the tax effect is not enormous.
As a dangerously broad generalisation, it is true for many people that their best option financially, with such low pension savings, is to withdraw it from their pot and to put it somewhere safe, ideally that generates income. They will find that their Pension Credit increases, once the withdrawal is made, because there is no longer any notional income assessed on it. As long as the total amount of capital that they possess at any one time is less than £10,000 there is no effect on their Pension Credit.
Lower levels of state pension or higher needs
The effects of low amounts of regular income can be substantial for those with full basic state pension. The non-coincidental level of the full new state pension, at just above Guarantee Pension Credit rates, is intended to ‘float’ people off a means-tested dependency. It will no doubt achieve this for many people; and is the justification for the abolition of Savings Pension Credit for recipients of the new pension. But it will not work for many people.
Some will have higher needs amounts than the basic Guarantee Pension Credit minimum income, because of disabilities or caring responsibilities. More will not have a full nSP. There are many reasons for this; insufficient contributions over a working life or inheritance of pension entitlement are probably the most common. Women may be the most likely to find themselves in this position and are also the most likely to have smaller amounts of pension savings. Over a third of women reach retirement single because of divorce or bereavement. Those receiving the basic state pension may also not get the pension at the full level but, for those who do, even the full level is not enough to float them off Guarantee Pension Credit.
Examples
These examples, with the tables and charts, are generated by Ferrets pensionForward system for advisers. Some apparent rounding errors in the tables are caused by the banding used in the assessment of income and capital by benefit rules.
Outcomes are very dependent on individual circumstances and no attempt to be made to extrapolate these results into other circumstances. These examples are all based on a single man aged 68 paying rent of £100 per week to a social landlord and paying £1250 per annum in Council Tax. In these examples, only basic state pension is being used. We will be happy to provide additional examples of other circumstances including new state pension, couples and different rates of pension savings and withdraw. All assessments are based on benefit rules and rates in the 2017/2018 tax year. The ‘Current Income’ figure shown in the tables and charts is, in these examples, state pension alone.
The top line shows the total income.
Full basic state pension
Varying Levels of annuity
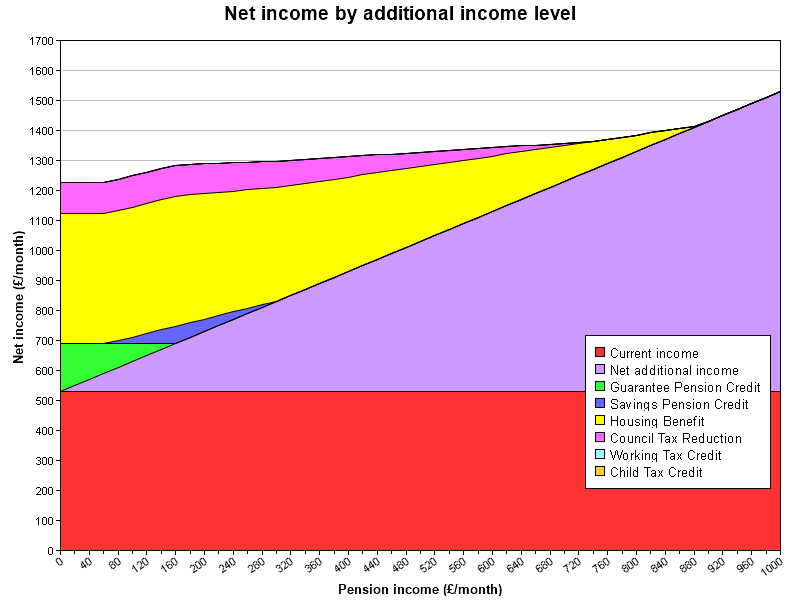
| Pension Income | Guarantee Pension Credit | Savings Pension Credit | Housing Benefit | Council Tax Reduction | Total including state pension |
| 0 | £160.55 | £0.00 | £433.33 | £104.17 | £1,228.02 |
| 40 | £120.55 | £0.00 | £433.33 | £104.17 | £1,228.02 |
| 80 | £80.56 | £8.88 | £433.33 | £104.17 | £1,236.91 |
| 120 | £40.56 | £32.89 | £433.33 | £104.17 | £1,260.92 |
| 160 | £0.56 | £56.90 | £433.33 | £104.17 | £1,284.93 |
| 200 | £0.00 | £41.43 | £417.99 | £99.45 | £1,288.84 |
| 240 | £0.00 | £25.44 | £402.35 | £94.64 | £1,292.40 |
| 280 | £0.00 | £9.45 | £386.75 | £89.83 | £1,296.00 |
| 320 | £0.00 | £0.00 | £366.86 | £83.72 | £1,300.55 |
| 360 | £0.00 | £0.00 | £340.90 | £75.75 | £1,306.62 |
| 400 | £0.00 | £0.00 | £314.90 | £67.73 | £1,312.60 |
| 440 | £0.00 | £0.00 | £288.90 | £59.76 | £1,318.63 |
| 480 | £0.00 | £0.00 | £262.90 | £51.74 | £1,324.61 |
| 520 | £0.00 | £0.00 | £236.90 | £43.72 | £1,330.59 |
| 560 | £0.00 | £0.00 | £210.90 | £35.75 | £1,336.62 |
| 600 | £0.00 | £0.00 | £184.90 | £27.73 | £1,342.60 |
| 640 | £0.00 | £0.00 | £158.90 | £19.76 | £1,348.63 |
| 680 | £0.00 | £0.00 | £132.90 | £11.74 | £1,354.61 |
| 720 | £0.00 | £0.00 | £106.90 | £3.73 | £1,360.60 |
| 760 | £0.00 | £0.00 | £80.90 | £0.00 | £1,370.87 |
| 800 | £0.00 | £0.00 | £54.86 | £0.00 | £1,384.83 |
| 840 | £0.00 | £0.00 | £28.86 | £0.00 | £1,398.83 |
| 880 | £0.00 | £0.00 | £2.90 | £0.00 | £1,412.87 |
| 920 | £0.00 | £0.00 | £0.00 | £0.00 | £1,449.97 |
| 960 | £0.00 | £0.00 | £0.00 | £0.00 | £1,489.97 |
| 1000 | £0.00 | £0.00 | £0.00 | £0.00 | £1,529.97 |
The results above show the effect of purchasing an annuity of amounts from 0 to £1000 a month. The effect of means testing this case is shown clearly by the fact that a £1000 variation in income received is reduced to £301 in value by the reduction in benefits. The first £60 of annuity income produces no real increase at all, until Savings Pension Credit begins.
Full basic state pension and severe disability
Varying Levels of annuity
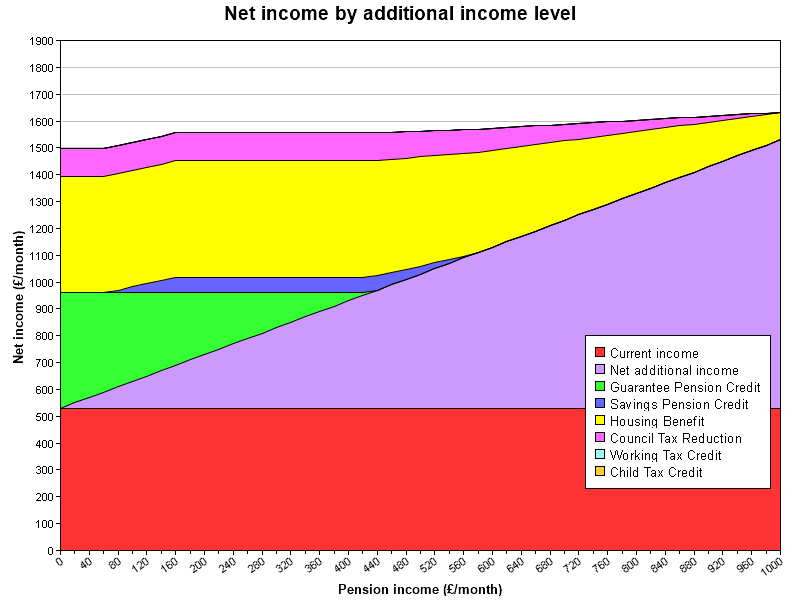
| Pension Income | Guarantee Pension Credit | Savings Pension Credit | Housing Benefit | Council Tax Reduction | Total including state pension |
| 0 | £431.17 | £0.00 | £433.33 | £104.17 | £1,498.64 |
| 40 | £391.17 | £0.00 | £433.33 | £104.17 | £1,498.64 |
| 80 | £351.17 | £8.88 | £433.33 | £104.17 | £1,507.52 |
| 120 | £311.18 | £32.89 | £433.33 | £104.17 | £1,531.54 |
| 160 | £271.18 | £56.90 | £433.33 | £104.17 | £1,555.55 |
| 200 | £231.18 | £57.20 | £433.33 | £104.17 | £1,555.85 |
| 240 | £191.19 | £57.20 | £433.33 | £104.17 | £1,555.86 |
| 280 | £151.15 | £57.20 | £433.33 | £104.17 | £1,555.82 |
| 320 | £111.15 | £57.20 | £433.33 | £104.17 | £1,555.82 |
| 360 | £71.15 | £57.20 | £433.33 | £104.17 | £1,555.82 |
| 400 | £31.16 | £57.20 | £433.33 | £104.17 | £1,555.83 |
| 440 | £0.00 | £53.69 | £429.91 | £103.13 | £1,556.70 |
| 480 | £0.00 | £37.70 | £414.27 | £98.32 | £1,560.26 |
| 520 | £0.00 | £21.67 | £398.71 | £93.51 | £1,563.86 |
| 560 | £0.00 | £5.68 | £383.11 | £88.75 | £1,567.51 |
| 600 | £0.00 | £0.00 | £360.79 | £81.86 | £1,572.62 |
| 640 | £0.00 | £0.00 | £334.79 | £73.88 | £1,578.64 |
| 680 | £0.00 | £0.00 | £308.79 | £65.87 | £1,584.63 |
| 720 | £0.00 | £0.00 | £282.79 | £57.85 | £1,590.61 |
| 760 | £0.00 | £0.00 | £256.79 | £49.88 | £1,596.64 |
| 800 | £0.00 | £0.00 | £230.79 | £41.86 | £1,602.62 |
| 840 | £0.00 | £0.00 | £204.79 | £33.84 | £1,608.60 |
| 880 | £0.00 | £0.00 | £178.79 | £25.87 | £1,614.63 |
| 920 | £0.00 | £0.00 | £152.79 | £17.85 | £1,620.61 |
| 960 | £0.00 | £0.00 | £126.79 | £9.88 | £1,626.64 |
| 1000 | £0.00 | £0.00 | £100.79 | £1.86 | £1,632.62 |
The results above show the effect of purchasing an annuity of amounts from 0 to £1000 a month. The benefits support for somebody with severe disability is higher. It therefore takes substantially more income before any real net gains seen. The effect of means testing this case is shown clearly by the fact that a £1000 variation in income received is reduced to £134 in value by the reduction in benefits. The net income from all sources, with an annuity of £160 a month is £1,556. Increase the annuity to £420 a month and the net income stays the same.
Full basic state pension with £10,000 pension savings
Regular withdrawal of income
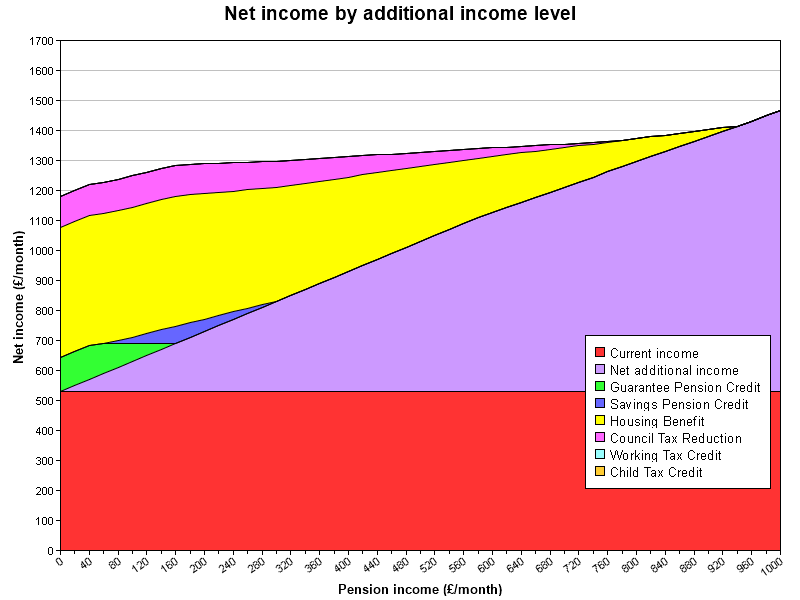
| Pension Income | Income Tax | Notional Income | Guarantee Pension Credit | Savings Pension Credit | Housing Benefit | Council Tax Reduction | Total including state pension |
| 0 | £0.00 | £46.67 | £114.01 | £0.00 | £433.33 | £104.17 | £1,181.48 |
| 40 | £0.00 | £46.67 | £114.01 | £0.00 | £433.33 | £104.17 | £1,221.48 |
| 80 | £0.00 | £46.65 | £80.56 | £8.88 | £433.33 | £104.17 | £1,236.91 |
| 120 | £0.00 | £46.56 | £40.56 | £32.89 | £433.33 | £104.17 | £1,260.92 |
| 160 | £0.00 | £46.38 | £0.56 | £56.90 | £433.33 | £104.17 | £1,284.93 |
| 200 | £0.00 | £46.11 | £0.00 | £41.43 | £417.99 | £99.45 | £1,288.84 |
| 240 | £0.00 | £45.76 | £0.00 | £25.44 | £402.35 | £94.64 | £1,292.40 |
| 280 | £0.00 | £45.32 | £0.00 | £9.45 | £386.75 | £89.83 | £1,296.00 |
| 320 | £0.00 | £44.79 | £0.00 | £0.00 | £366.86 | £83.72 | £1,300.55 |
| 360 | £0.00 | £44.18 | £0.00 | £0.00 | £340.90 | £75.75 | £1,306.62 |
| 400 | £0.00 | £43.47 | £0.00 | £0.00 | £314.90 | £67.73 | £1,312.60 |
| 440 | £0.00 | £42.68 | £0.00 | £0.00 | £288.90 | £59.76 | £1,318.63 |
| 480 | £0.00 | £41.80 | £0.00 | £0.00 | £262.90 | £51.74 | £1,324.61 |
| 520 | £0.00 | £40.84 | £0.00 | £0.00 | £236.90 | £43.72 | £1,330.59 |
| 560 | £0.00 | £39.78 | £0.00 | £0.00 | £210.90 | £35.75 | £1,336.62 |
| 600 | -£4.33 | £38.64 | £0.00 | £0.00 | £187.72 | £28.60 | £1,341.96 |
| 640 | -£10.31 | £37.42 | £0.00 | £0.00 | £165.62 | £21.80 | £1,347.08 |
| 680 | -£16.34 | £36.13 | £0.00 | £0.00 | £143.52 | £14.99 | £1,352.14 |
| 720 | -£22.31 | £34.76 | £0.00 | £0.00 | £121.42 | £8.19 | £1,357.27 |
| 760 | -£28.30 | £33.31 | £0.00 | £0.00 | £99.28 | £1.39 | £1,362.34 |
| 800 | -£34.36 | £31.79 | £0.00 | £0.00 | £77.22 | £0.00 | £1,372.83 |
| 840 | -£40.35 | £30.19 | £0.00 | £0.00 | £55.12 | £0.00 | £1,384.74 |
| 880 | -£46.32 | £28.51 | £0.00 | £0.00 | £32.98 | £0.00 | £1,396.63 |
| 920 | -£52.35 | £26.76 | £0.00 | £0.00 | £10.92 | £0.00 | £1,408.54 |
| 960 | -£58.33 | £24.93 | £0.00 | £0.00 | £0.00 | £0.00 | £1,431.64 |
| 1000 | -£64.35 | £23.02 | £0.00 | £0.00 | £0.00 | £0.00 | £1,465.62 |
This example shows the effect of drawing down income (with a 25% tax-free allowance). The green cells show the amount taken into account as income, where the amount drawn down is less than the notional income figure that notional amount is used. Where the amount is greater, the actual figure is used. Somewhat misleadingly, it appears that taking less than the notional income figure gives a real gain of the whole amount in income. What is happening in fact is that this amount has already been deducted because of the use of the higher notional income figure. Once the actual amount being withdrawn is used it can be seen that a marginal deduction rate of about 85% applies across much of the range.
Full basic state pension with £10,000 pension savings
Taking lump sums from pension savings
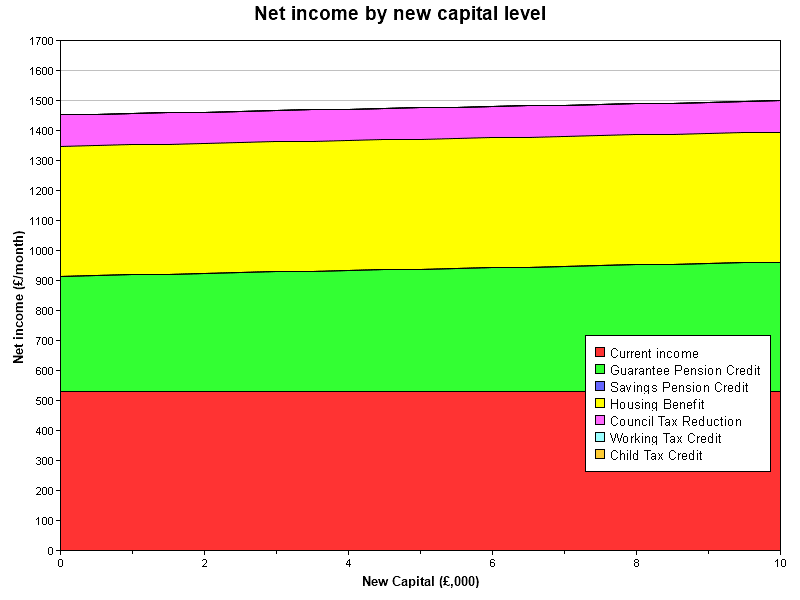
| Pension Capital withdrawn | Capital received after tax | Notional Income | Guarantee Pension Credit | Savings Pension Credit | Housing Benefit | Council Tax Reduction | Total including state pension |
| 0 | £0.00 | £46.67 | £384.63 | £0.00 | £433.33 | £104.17 | £1,452.10 |
| 1000 | £1,000.00 | £42.00 | £389.26 | £0.00 | £433.33 | £104.17 | £1,456.73 |
| 2000 | £2,000.00 | £37.33 | £393.94 | £0.00 | £433.33 | £104.17 | £1,461.41 |
| 3000 | £3,000.00 | £32.67 | £398.58 | £0.00 | £433.33 | £104.17 | £1,466.05 |
| 4000 | £4,000.00 | £28.00 | £403.26 | £0.00 | £433.33 | £104.17 | £1,470.73 |
| 5000 | £5,000.00 | £23.33 | £407.90 | £0.00 | £433.33 | £104.17 | £1,475.37 |
| 6000 | £6,000.00 | £18.67 | £412.53 | £0.00 | £433.33 | £104.17 | £1,480.00 |
| 7000 | £6,978.04 | £14.00 | £417.21 | £0.00 | £433.33 | £104.17 | £1,484.68 |
| 8000 | £7,828.04 | £9.33 | £421.85 | £0.00 | £433.33 | £104.17 | £1,489.32 |
| 9000 | £8,678.04 | £4.67 | £426.53 | £0.00 | £433.33 | £104.17 | £1,494.00 |
| 10000 | £9,528.04 | £0.00 | £431.17 | £0.00 | £433.33 | £104.17 | £1,498.64 |
The illustration above shows the, initially, counterintuitive effect of taking money, as lump sums, from pension savings. The increase in capital, in this example, does not reach a level to effect any entitlement to Pension Credit. As capital is taken out of the savings, the remaining amount reduces and sodas the notional income that it generates. The effect is to increase the entitlement to benefits.
Conclusion
For many people, particularly the kind of customers that financial advisers deal with, the considerations discussed here may not be relevant. But many people is not even most people. Many people may benefit from their pension savings being converted into a wage for life but that is not justification for forgetting that many people may not.
If the reaction to some difficulties or abuses, that have followed the pension freedoms, is to return to a compulsory regular income, or even to the situation where that is the default preference, then many people may be badly affected.
The sadness is that many of those people are already affected, because they are not getting the advice and information they need to make properly informed choices. Many people – most people (including policy makers) – are not aware of the issues touched on in this paper. Finding a source of information or advice, which can offer the detailed personal assessment that they need, is virtually impossible. Funding for advice services in this country has fallen very substantially in recent years, financial advisers do not deal with these type of clients and government funded provision cannot go into sufficient detail.
What is needed are services beyond silo-limited specialists, however well motivated, who only understand part of the picture. Perhaps the new single financial guidance body, to be set up by the Financial Guidance and Claims Act will be able to offer the necessary holistic support.
Perhaps.
(Please let me know if you’d like this as a PDF).
[1] https://www.ons.gov.uk/peoplepopulationandcommunity/personalandhouseholdfinances/incomeandwealth/datasets/earlyindicatorestimatesfromthewealthandassetssurvey OExpinc Data
[2] Income-related benefits: estimates of take-up. DWP 2013
[3] Council Tax Benefit – Income-related benefits: estimates of take-up DWP 2013
[4] Government Actuary’s Department tables
Comments
Please could you send me this as a PDF. Thank you.
This is very helpful to me as i am due to retire within the next six years.I am a low wage earner with a small pension.