The Benefits Cap and Real Income Levels
by Gareth Morgan on February 7, 2014
Many commentators have pointed out the misleading justifications often made for the introduction of the benefits cap. The government has said that it is unfair that people dependant on benefits should receive more than those in work at the average wage. This message ignores the fact that most workers earning the average wage will still qualify for benefits which top up their earnings.
Although this point has been made frequently, there has been little quantification of the amounts involved. I’ve used the April 2014 edition of Ferret’s Future Benefits Model (FFBM) to generate a set of tables to quantify the amounts of benefit and tax credit applicable to different types of families in differently priced rented accommodation. The modelling assumes that gross earnings are at the cap level for both single people and for one earner in a couple. There are figures for the current benefits schemes and for Universal Credit.
Thr chart below shows an example of this for a single person with for 0 to 6 children. Without children the cap level is £350 a week, with children it’s £500 a week.
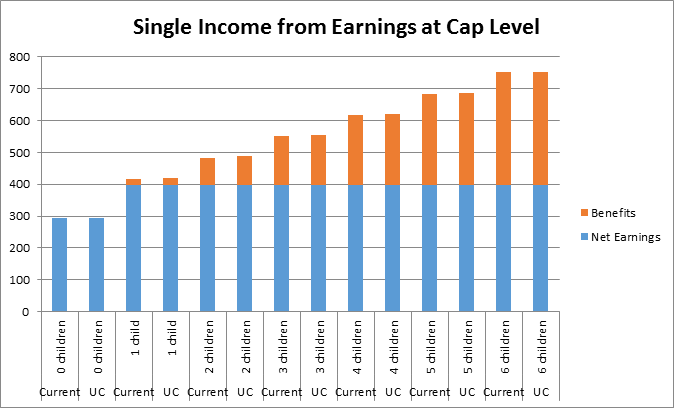
Single Cap Earnings
The other chart below is the same calculation, but for couples. The cap level is £500 for them, with or without children.
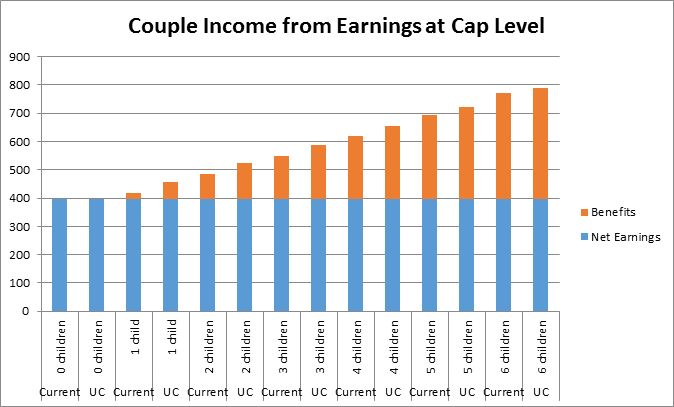
Couple Cap Earnings
The full tables show the benefits entitlements and total net incomes of single people and couples, with from 0 to 6 children in a number of different housing circumstances. The model assumes 35 hours of work; at these hours of work, or earnings levels for Universal Credit, no capping is applied.
There are two sets of tables
Standard rent – illustrates what additional benefits are payable for different compositions of families with full-time gross earnings at the cap level. In these examples there is a single rent level for all households in social and private housing. This shows, as might be expected,
• Only childless families receive no additional benefits with earnings at the cap level.
• Additional children receive extra support from the benefits system for working people.
• The benefits cap takes no account of the greater needs of families with more children.
Varied rents in 7 different areas – where the rent levels are set in two different ways.
• Within each area, the social rent levels and private sector levels are set by reference to the appropriate housing size for each family.
• Areas use increasing levels of rent set in bands from the lowest average social rents in Britain and the lowest LHA levels, in a local authority or Broad Rental Market Area, to the highest.
A simple message is clear from these examples.
• The Housing Benefit and Universal Credit schemes take account of higher rents for larger families who are not subject to the cap.
• The benefits cap takes no account of the higher rent amounts typically needed for bigger properties needed for larger families.
You can download the tables and charts here.
Leave a Reply