The real comparisons for capping
by Gareth Morgan on February 2, 2012
The pro-cap speakers in Parliament have consistently focused on one argument, why should people out of work be better off than those in work in the same situation?
Although others have tried to point out that those in work also get benefits to support them, the point has not seemed to be grasped. I thought it was worth (even now) putting some figures into the argument so I’ve put some simple comparisons into our Future Benefits Model (FFBM) and the results are below.
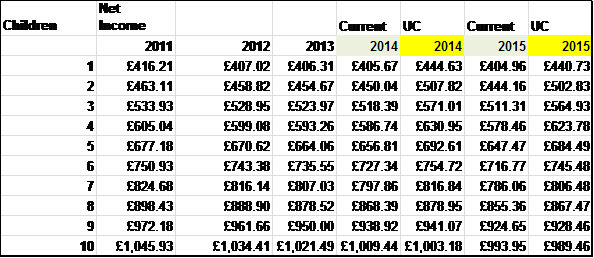
The first example looks at a couple with one partner working 35 hours a week, earning £26,000 a year gross (a notional average wage) and paying rent of £100 a week and Council Tax of £1,250 a year. I then modelled the situation with varying numbers of children from 1 to 10.
The net earnings are the same, of course, regardless of the number of children at £385.43 a week (£20,042.36 a year). The remainder of the family’s income is made up of Child Benefit, Child Tax Credit, Housing Benefit and Council Tax Benefit.

Net income increases as the number of children in the family increases, reflecting the benefits system view of the increased needs.
When these families move onto Universal Credit their situation is similar.

There is actually a small increase in benefits for those with up to 7 children under Universal Credit (not the case for those with much lower earnings).
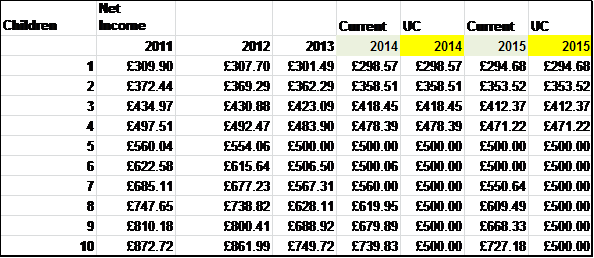
If this family is not in work, and therefore subject to the cap as reintroduced by the Commons, the situation is very different.
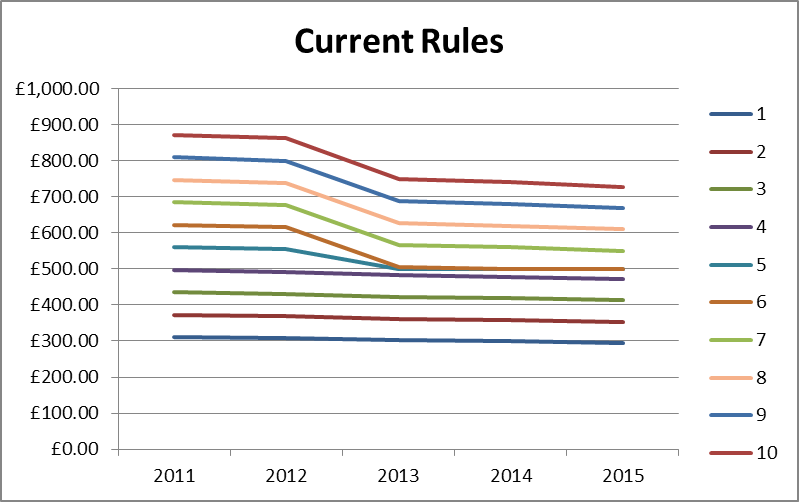
Before the cap is applied, there is a clear amount attributable to each child in the make up of their support. While they remain on the current benefit scheme the maximum amount of the cap, from 2013, is limited to the level of Housing Benefit that they are entitled to, so there is still some additional benefit for each extra child.
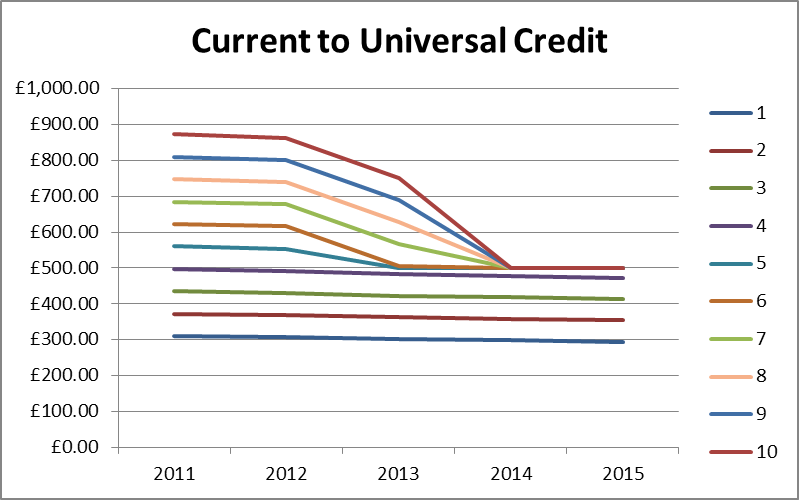
On Universal Credit, with the full rigour of the cap, there is no protection for additional children and the chart shows this clearly.
If we look more closely at the figures, some points worth commenting on appear.
The table for the family working for average earnings (Apologies that it’s an image, I can’t get tables to work here).
The table for those out of work.
If we compare that with a table showing the benefits that are payable to the family in work, the results are interesting.

I find it interesting:
that a working family with 8 or more children would currently get more in benefits than the total cap figure is suggested to be. With realistic figures for rental of a suitably sized house, at LHA levels, the figure could be substantially higher and apply to those with fewer children.
there are no circumstances where the out of work family has an income less than about £100 a week lower than the working family and with Universal Credit it may be more than £500 a week lower because of the cap.
It is curious that the family on average earnings may easily receive more in benefits than in net earnings when that seems to have been the justification for capping those out of work.
Comments
Same old Tory Policies which penalise the pnedurt savers.What is the point in saving for the future when at the first sign of trouble ie sickness or unemployment, any reasonable saved amount means no help ? I am not against any interest made counting as taxable income and a reduction being made for this amount,but really to deduct a31 a week or a352 a year on every a3250 over a36000 is ridiculous.If I knew how to get 20%+ pa nett return on savings, I would be a financial genius and not be in need of any benefits at all !