Some random jottings on the current benefits situation – no. 1 The Benefit Cap.
by Gareth Morgan on April 21, 2020
I’m not going to write much about what benefit changes have taken place recently, and there are lots of them, but a little bit about how they might affect people.
This is because I’ve just finished the first baseline run of Ferret’s Future Benefits Model for 2020 to 2024. This is our big five-year rolling horizon model of the tax-benefit system. It’s scenario-based, meaning that it takes different family sizes and compositions, housing types and costs, and work hours and earnings. The various combinations mean that the baseline ends up with several million individual calculations.
The baseline is really intended to be used for research comparisons, such as changing rules or rates to assess the effects, real income gains from working or earning more, or for affordability assessments in areas such as rents or childcare costs. On its own, though, it does produce some interesting, and occasionally different, pictures of how the benefit system works.
The new model does include the changes introduced to the benefits system following the coronavirus outbreak.
I had intended to cover a number of different points in this article, but having started with the benefit cap, it ‘growed’ to the point where this is clearly going to have to be a number of jottings, looking at discrete issues, if there can be such things in an integrated benefits system.
The Overall Benefit Cap
The benefit cap limits the amount of benefit, from many sources, that a household can receive. The ones that I’m interested in, in this note, are the means tested benefits and child benefit. The cap applies at different rates in London and the rest of the UK. There are some groups of people which it does not apply to, including those who receive disability benefits or war pensions. It also doesn’t apply to households where people ‘do enough work‘ – more on that later.
In brief, the total amount of benefits received are compared to the cap amount and, if greater, the total is reduced to the amount of the cap. For those getting legacy benefits, the only benefit that can be capped is housing benefit, up to the full amount. If on Universal Credit, the whole of that benefit can be capped.
The benefit cap outside Greater London is:
- £384.62 per week (£20,000 a year) if you’re in a couple
- £384.62 per week (£20,000 a year) if you’re a single parent and your children live with you
- £257.69 per week (£13,400 a year) if you’re a single adult
The benefit cap inside Greater London is:
- £442.31 per week (£23,000 a year) if you’re in a couple
- £442.31 per week (£23,000 a year) if you’re a single parent and your children live with you
- £296.35 per week (£15,410 a year) if you’re a single adult
One of the issues, that our modelling demonstrates clearly, is the way that the benefit cap affects a lot of people in a variety of ways unrelated to the stated justification of the cap. The justification for the cap has always been weak.
“From 2013 the Government will introduce a cap on the total amount of benefits that working-age people can receive so that workless households can no longer receive more in benefits than the average family earns.
The cap will be based on the median earnings after tax and National Insurance contributions for working households from 2013, which we expect to be around £500 for couples and lone parent households and £350 per week for single adults.”
http://www.dwp.gov.uk/adviser/updates/spending-review-2010/
I’ve looked at the cap a number of times before, since 2011, and in particular in 2013 in https://benefitsinthefuture.com/the-impact-of-a-20000-benefit-cap/ and 2014 with https://benefitsinthefuture.com/the-benefits-cap-and-real-income-levels/ so another look now is justified anyway.
To begin with the justification for the cap; “so that workless households can no longer receive more in benefits than the average family earns”
That doesn’t sound too unfair; people who work hard and have earned all the money they have to spend, shouldn’t be disadvantaged. But a lot of people who work hard, don’t earn all the money they need. That’s why we have in work-benefits, Child Benefit, Housing Benefit and other help. The amount of pay that people get is generally related to the work they do, not to the needs that they may have. A young single person living in their parents’ home rent free may get the same pay, for the same work, as the parent of large family with a disabled partner, paying a high private rent. That’s why the benefit system provides help to working people, with higher needs and lower pay. In July 2019, about 1/3 of people claiming Universal Credit were in work.
That means that many people on, or above, median earnings also received benefits. Their incomes are therefore higher, sometimes much higher, than their earnings.
I modelled, using the FFBM, some examples of that in 2014, when all children still qualified for help with Universal Credit and the cap levels were higher.
Figure 1 shows an example of this for a single person with for 0 to 6 children. Without children the cap level was £350 a week, with children it was £500 a week.
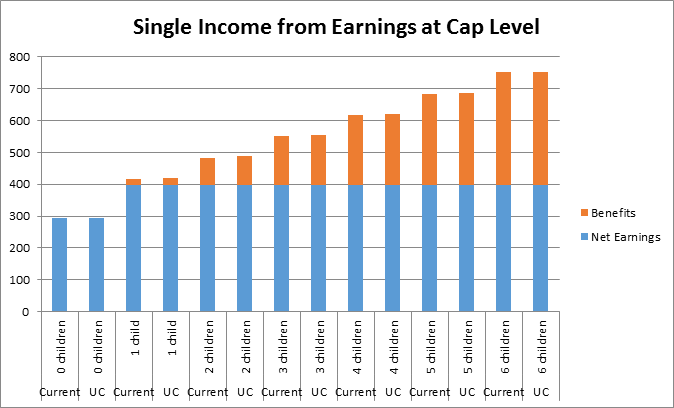
Figure 1 Single Cap Earnings 2014
Figure 2 is the same calculation, but for couples. The cap level was £500 for them, with or without children.
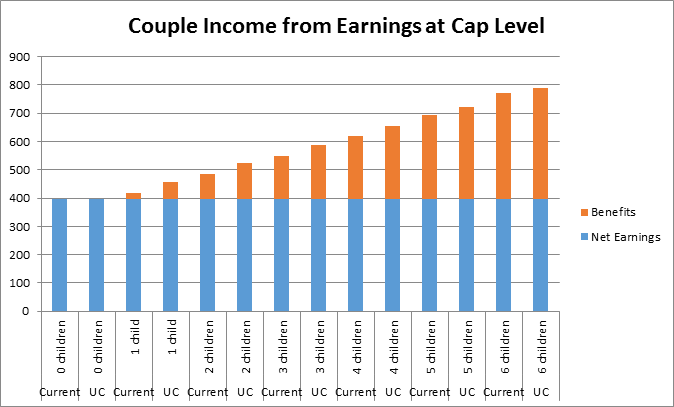
Figure 2 Couple Cap Earnings 2014
These charts compared legacy benefits, then labelled current, and Universal Credit overall income levels.
In the 2020 / 2021 modelling the results are not too dissimilar, although the levels of the cap were sharply reduced in 2016. The charts use the lower cap levels outside London. The model increases rent levels as the family size increases, and LHA levels are not applied. Earnings at cap level do not, of course, do not require the benefits they receive to be capped.
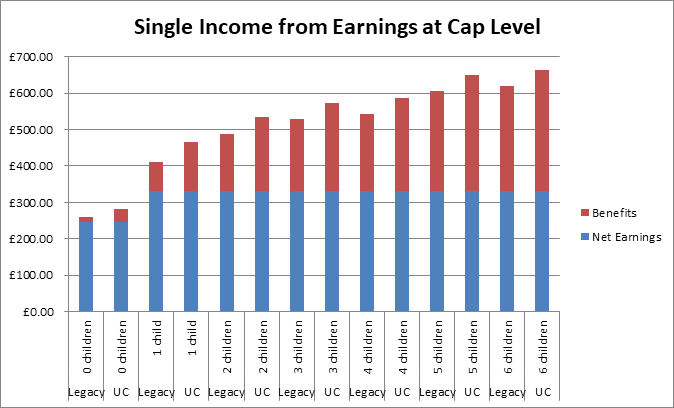
Figure 3 Single Cap Earnings 2020
You will notice that the earnings and cap level are now lower and might expect benefit entitlement, on those earnings, to be higher. The benefit levels have been affected by the cuts and four-year freeze of the welfare reform and austerity period and these charts also assume that all children have been born since 2017 and are affected by the two-child limit.
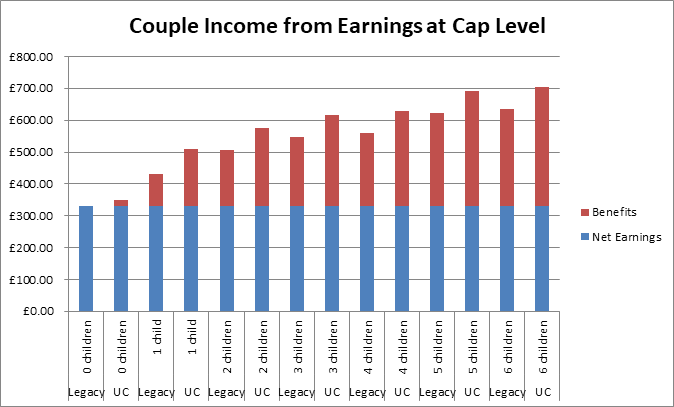
Figure 4
The charts show how much support the benefit system has decided is needed by people at these earnings levels. It is inescapable logically, to see the cap level as anything other than a method of penalising insufficient work or earnings.
Any link to median net earnings didn’t last long. Average gross earnings increased by over 20% between November 2010 and November 2019, so the level of the cap might have been expected to have increased as well, from the initial amount in 2013 of £500 for couples and lone parent households and £350 per week for single adults.
Today, in 2020, the cap amounts, in London, are £442 a week for couples and lone parent households and £296 for single people. Outside London they’re £385 and £258.
For legacy benefits, where only Housing Benefit is capped, the cap doesn’t apply to people getting Working Tax Credit, or who would if their earnings weren’t too high. That’s really been an hours of work test, which doesn’t work for Universal Credit, where hours of work are irrelevant. Instead there’s a crude, cliff-edge, test where the cap doesn’t apply to those with net earnings over 16 times the National Living Wage. That’s £139.52 a week, whether single or joint earnings if a couple, which is well below the NI and tax thresholds.
Universal Credit capping effects
Table 1 demonstrates the cliff-edge effect at the point at which capping ceases to apply, at 16 times the National Living Wage, or £139.52. The two columns in table 1 below show weekly earnings of £139.50, which is a capped level of earnings, and £139.54, which is not. The earnings levels are below the starting point for National Insurance and normal PAYE tax. This example shows a couple with 2 children, paying £200 a week rent and £1250 a year council tax.
The difference of 4p a week gross, generates a net income increase, or loss, of £54.78 a week, £2,848 a year or £237.38 a month.
| Gross Earnings / Net Profit | 139.50 | 139.54 |
| Net Earnings – after Income Tax and N.I. | 139.50 | 139.54 |
| Benefits & Credits Income | ||
| Council Tax Support | 21.15[1] | 15.81 |
| Child Benefit | 35.00 | 35.00 |
| Other Income | 0.00 | 0.00 |
| Universal Credit | 409.73 | 409.70 |
| Total Net Income | 605.38 | 600.05 |
| Table 1
Weekly Benefit cap Hit? |
Capped by | Not capped but benefit in excess of £384.62 by: |
| Excess benefit over £384.62 | 60.11 | 60.08 |
| Weekly Income if capped | 545.27 | 539.97 |
| Actual Weekly Income | 545.27 | 600.05 |
[1] Assessed income reduced by capping rules
Table 1
At these earnings levels, the worker is well below the levels at which auto-enrolment for pension contributions begins. That doesn’t stop them making pension contributions, which they are encouraged to do by government and most people advising on financial issues. In this case that may be unwise. Universal Credit is actually quite generous in the way it treats payment into pension savings. It disregards 100% of contributions when working out net earnings. That’s better than most legacy means-tested benefits where only 50% is ignored.
Saving £1 into a pension scheme this month will reduce the net earnings used in the calculation by £1 and increase Universal Credit by 63p next month. That’s normally a very sensible thing to do.
In this example it may not be. Paying anything over 4p a week into a pension scheme would mean that the level of net earnings for the second, uncapped, column would drop and the family would find themselves capped as well. Pay £1 and lose about £60 because you followed sensible financial guidance?
Increase Work?
I said earlier that it is inescapable logically, to see the cap level as anything other than a method of penalising insufficient work. What does that mean in practice?
The benefit cap level hits families particularly hard. If they need, and are entitled to, larger properties, with more bedrooms, because they have children, then the rents are likely to be higher.The level of the cap is such that some of those with moderate rent levels remain unaffected. Figure 5 shows a single parent with two children, paying £125 a week rent, and what happens as earnings increase.
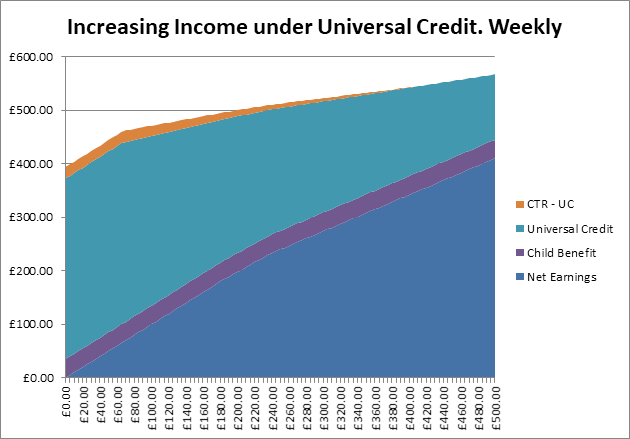
Figure 5
The top line shows the overall income for this family and its noticeable how steeply income rises as work begins. This is an example which how the work allowance means that the claimant keeps all of their net income until the work allowance is exhausted, after which the Universal Credit taper ensures that less of any earning increase is retained. The family with no earnings has £269.14 left after meeting their rent.
The same family in a high rent area, such as Guildford, are not so lucky. The limits on rent levels that can be met from benefit, the Local Housing Allowance (LHA), have been increased this April, reversing some of the reductions over past years. The limit, for a three-bedroom house, has increased from £276.07 per week to £316.44 per week. In practice, that increase not only has little value to many people but, if rent is increased to the LHA level, or a family move into a property at that level, they may become worse off. At the lower rent level, the same family with no earnings would be hit by the benefit cap, so that they would be left with £129.70 after paying the rent. At the higher rent level, also capped, the family has just £89.33 left after paying rent.
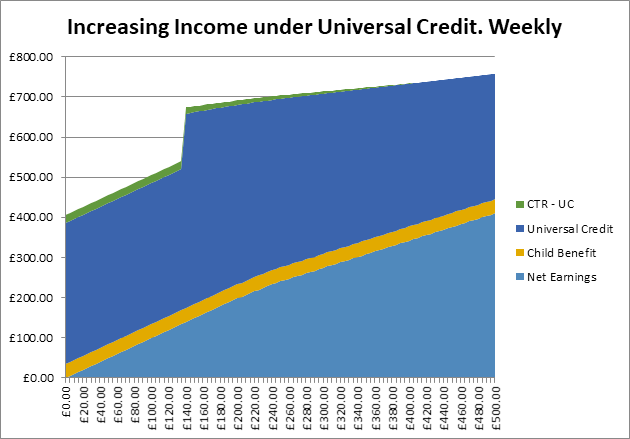
Figure 6
Figure 6 shows that as earnings increase, this household sees the same steep increase in Universal Credit as, firstly, the work allowance is used and then the benefit cap is eroded. The sudden jump in Universal Credit, and income, happens when earnings pass the cap threshold figure of £132.09 (16 times the National Living Wage) and the cap no longer applies. Following that the increase, as expected, becomes much more gradual as earnings are tapered.
Legacy benefits
The benefit cap also affects legacy benefits. Only housing benefit can be limited or reduced by the cap and its application is slightly different. For people who are working, there isn’t an earnings threshold, as in Universal Credit, but one based on entitlement to working tax credit. That has a couple of consequences, because of the way that entitlement to the benefit is determined. The amount of earnings has no relevance, only the number of hours worked.
Consider a couple with two children, paying £253.15 a week rent. One is working with hourly pay of £8.72, the national living wage.
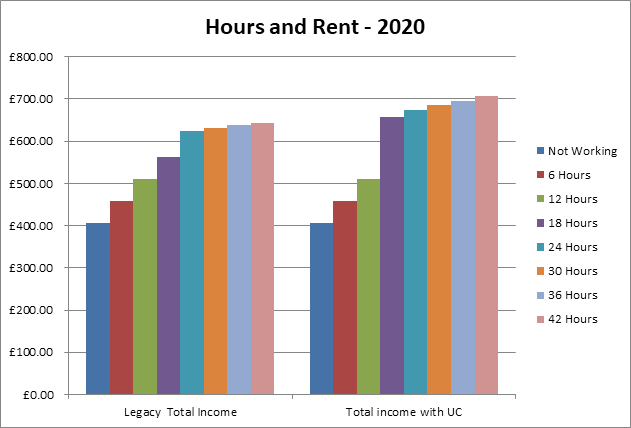
Figure 7
Figure 7 shows the different total incomes when claiming legacy benefits or Universal Credit. When not working, in both schemes, benefit is capped, and total income is £405.77 a week
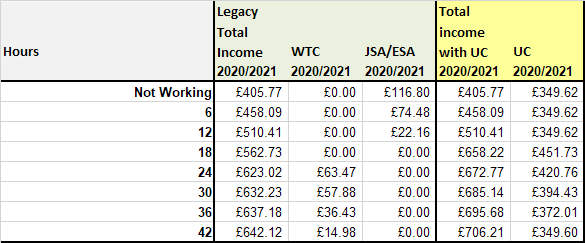
Table 2
At 12 hours work each week, both schemes are still capped, giving an income of £510.41 as shown in table 2. At 18 hours, the schemes diverge; the legacy scheme is still capped by £14.44. Universal Credit, although having an excess income figure of £102.11, is not capped as earnings are now above the threshold figure, and a leap in income is produced
18 hours work is an unfortunate number for those on legacy benefits as it is above the 16 hours limit where jobseekers allowance could be paid but below the 24 hours limit needed for this couple to claim working tax credit. At 24 hours work, working tax credit entitlement begins and the family catch up a little.
As an aside, if the same worker had been receiving the London living wage of £10.75 an hour, the extra £2.03 each hour does not translate into a similar gain in real income as shown in table 3
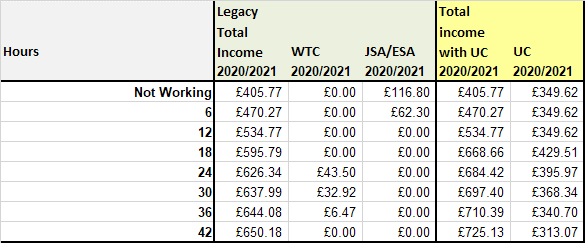
Table 3
The Future
While managed migration, the transfer en-masse of legacy benefit claimants to Universal Credit, seems to be moving further away, there are benefit cap implications there as well.
The comparison of total legacy benefit and Universal Credit will be calculated once the Benefit Cap has been applied to both amounts. However, Benefit Cap rules will still apply…
Universal Credit Policy Briefing Note, Dec 2012
This accords with the rules applied to the Harrogate pilot of managed migration.
There are winners and losers in any moves from legacy benefits to Universal Credit, but the benefit cap will not help make things clearer. Table 4 shows a five-year forecast, adjusted for real value using OBR forecast for inflation, earnings and benefit rate increases. The table looks at overall incomes for part-time work
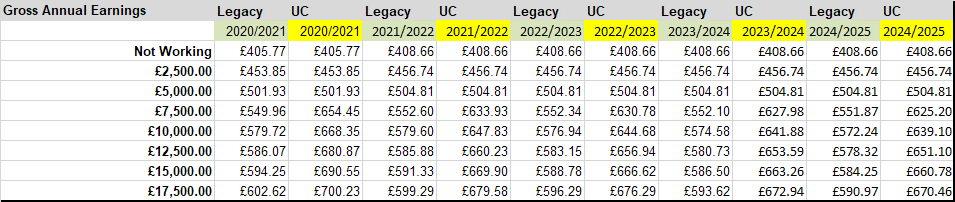
Table 4
The benefit cap continues to apply to legacy benefits, working tax credit hours are never reached, but ceases to apply for Universal Credit when threshold earnings are achieved. Figure 8 shows, over a range of annual earnings, the effect of moving schemes in 2022.
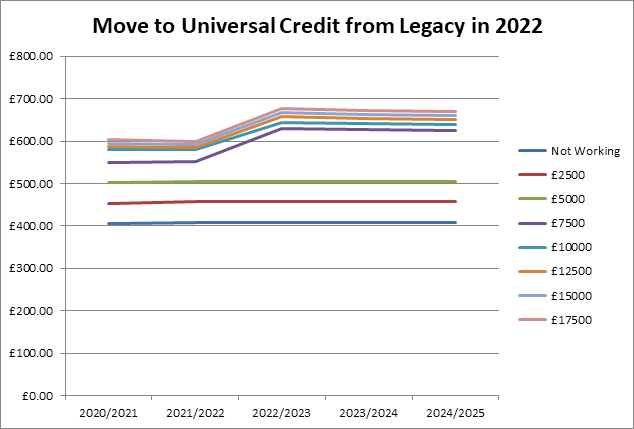
Figure 8
Here the family gain, as they’re moving from a capped to an uncapped scheme once their earnings exceed the threshold figure. The large change in income once earnings reach £7500 a year demonstrates, once again, how extreme the cap can be. Individual circumstances will decide on gains, losses and cap effects on transition.
Conclusion
The coronavirus impact has forced the government into making large changes in economic support and in benefit rules. Not only are these applying to a much greater number of people than had been expected but some of the rule and rate changes have been apparently generous, in comparison with the past decade of cuts. Many of these headline changes are subject to the benefit cap, however, and that can very seriously affect the end result.
The cap is complex, adding to the already difficult to understand benefit system, where the interaction of different rules can sometimes seem to contradict each other. It is, for example, somewhat peculiar that the benefit cap can, in some ways, reduce the losses caused by the two-child limit.
What is inescapable is that a benefits system supposedly designed to provide a minimum decent standard of living, then has cuts applied which can only push people below that line.
Gareth Morgan
April 2020
ps. As a small advert, I’m always happy to talk to anybody interested in how they might make use of our model.
Leave a Reply